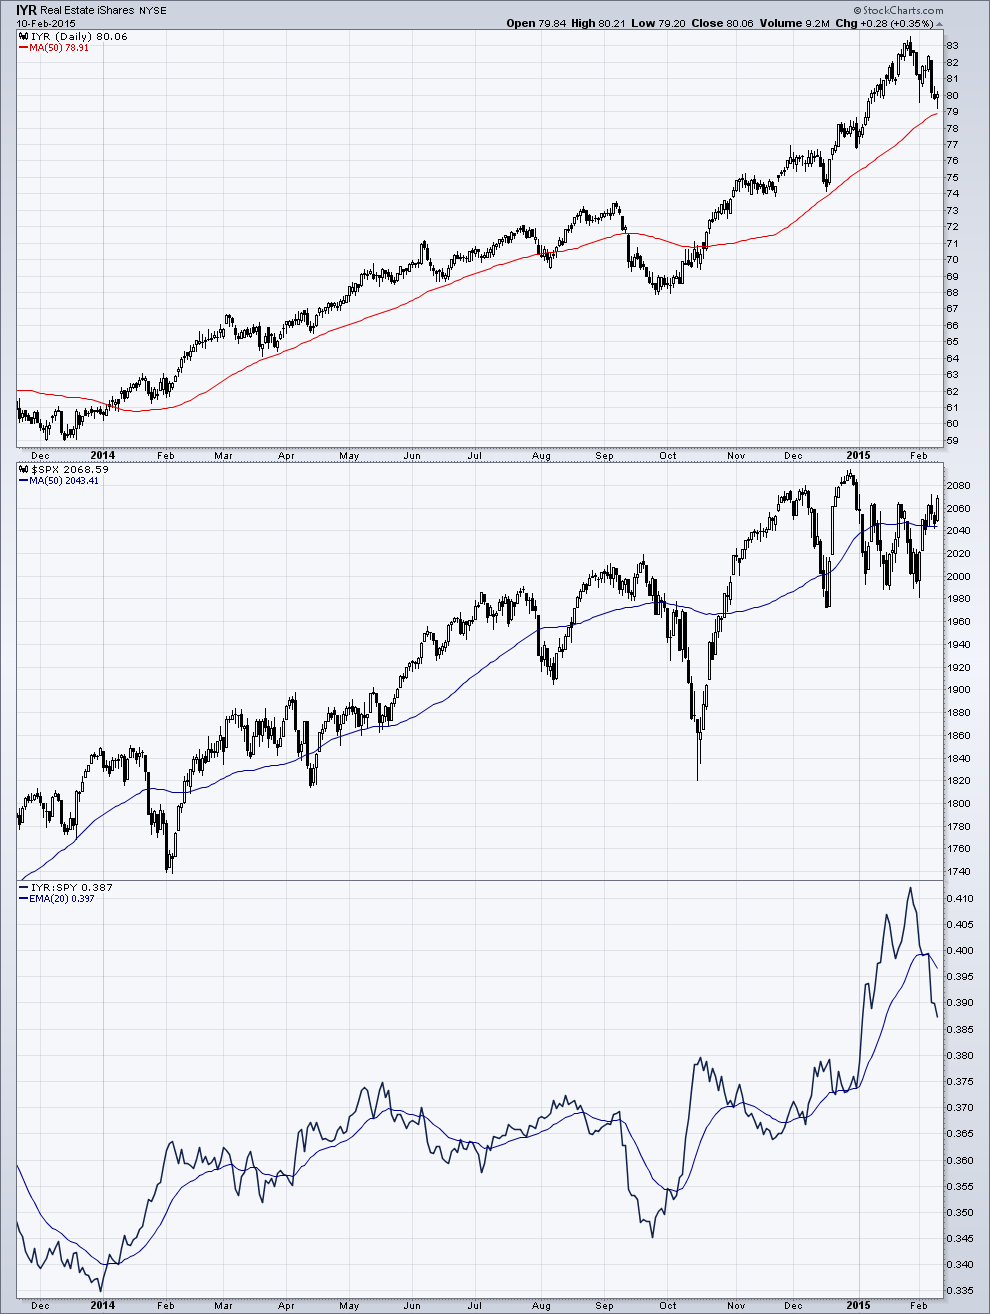
Over the past two weeks high yielding securities have come under pressure and Real Estate Investment Trusts (REIT’s) have not been exempt. As seen in the chart below, the iShares Real Estate ETF (IYR) has been in an uptrend with the biggest pullback occurring in October 2014 in sympathy with the whole market.
Also looking at the relative strength chart of IYR to S&P 500 (SPY), the longer-term outperformance has seen periods of underperformance. Certainly we can put IYR on our radar, but we are currently seeing corrective price action that is also showing up in the relative strength chart.
Investors will need to monitor this development and use discipline in analyzing the extent of the pullback.
What Should Investors Watch For?
- Potential support at the 50 Day Moving Average
- Wait for relative strength to turn positive and retake the 20EMA.
Until more positive developments occur, IYR simply remains on my watch list.
iShares Real Estate ETF (IYR)
Follow Karl on Twitter: @Snyder_Karl
No position in any of the mentioned securities at the time of publication. Any opinions expressed herein are solely those of the author, and do not in any way represent the views or opinions of any other person or entity.


