In today’s research article we will discuss why we continue to be bullish on Medtronic stock (NYSE:MDT).
We’ll look through several charts and discuss the technical setups as well as the fundamental backdrop. This will clearly highlight Medtronic as a bullish stock to put on your radar for 2018.
Medtronic (MDT) is medical device company that operates in more than 160 countries worldwide. They are a global healthcare solutions company providing medical technologies, services and solutions.
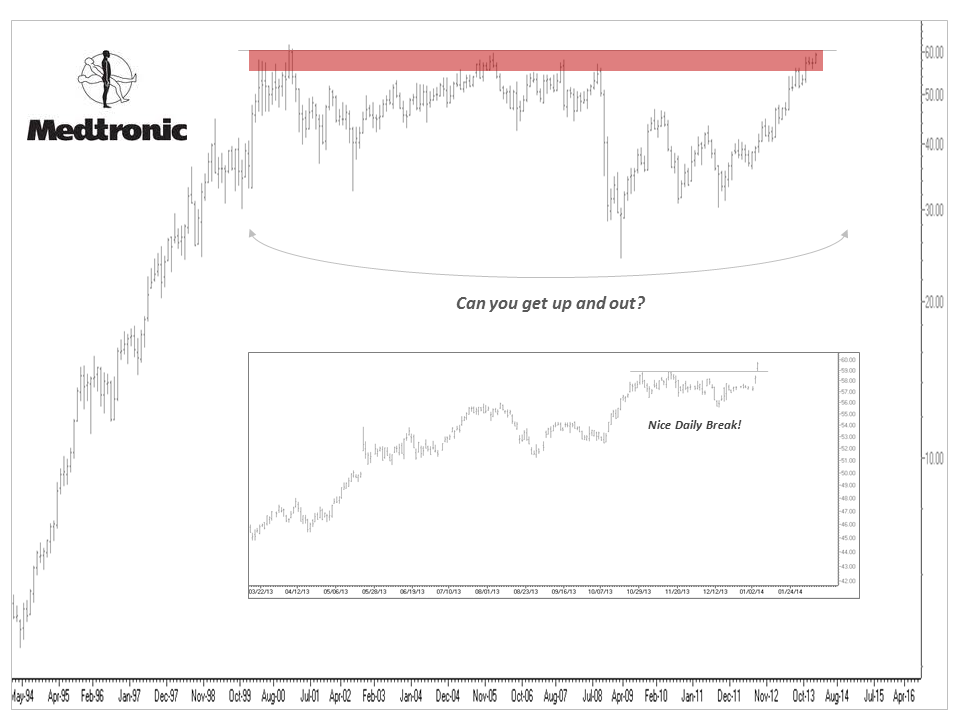
We became bullish on Medtronics (MDT) on January 6, 2014 after seeing great action in this name (and industry) that came with plenty of new 52-week highs. MDT broke out on its short-term daily chart and appeared poised to break out of a 13-year base on its longer-term monthly chart, according to John. Here’s a before and after look at the stock…
BEFORE: 2014 Medtronic Daily Stock Chart Bullish Setup
AFTER: 2018 Medtronic Monthly Stock Chart & Bullish Continuation
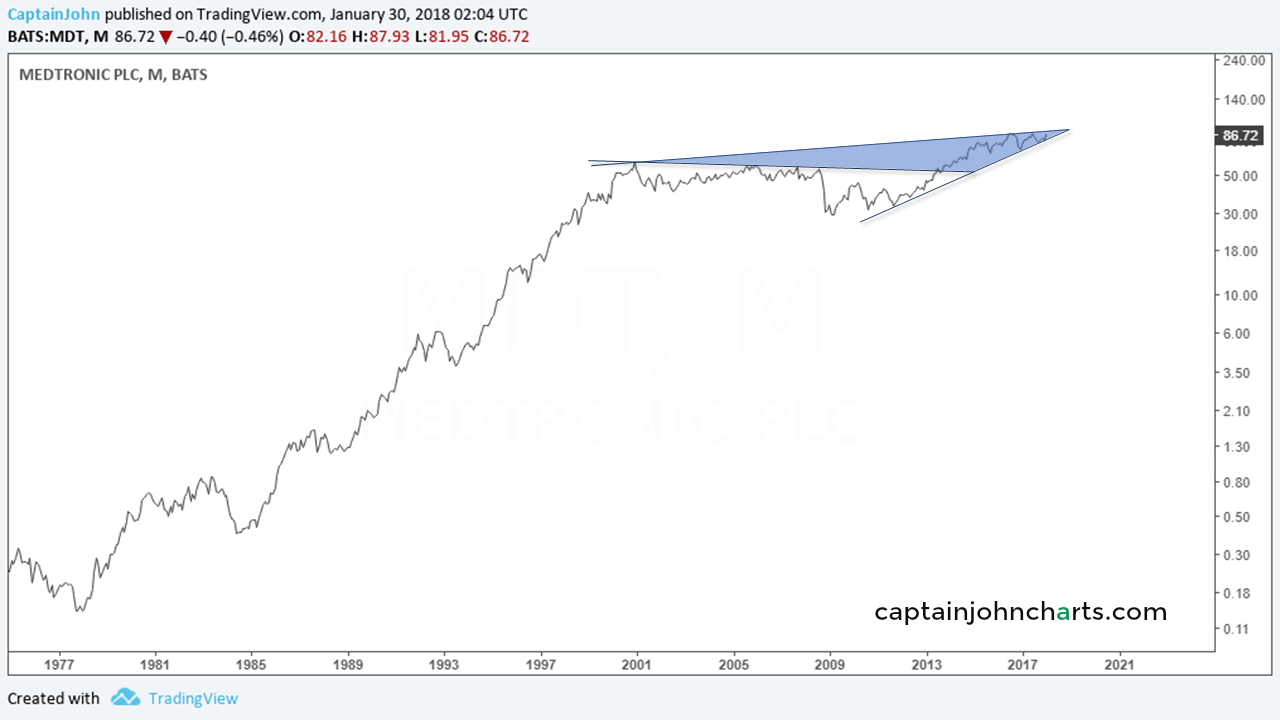
There is a massive multi-year base breakout.
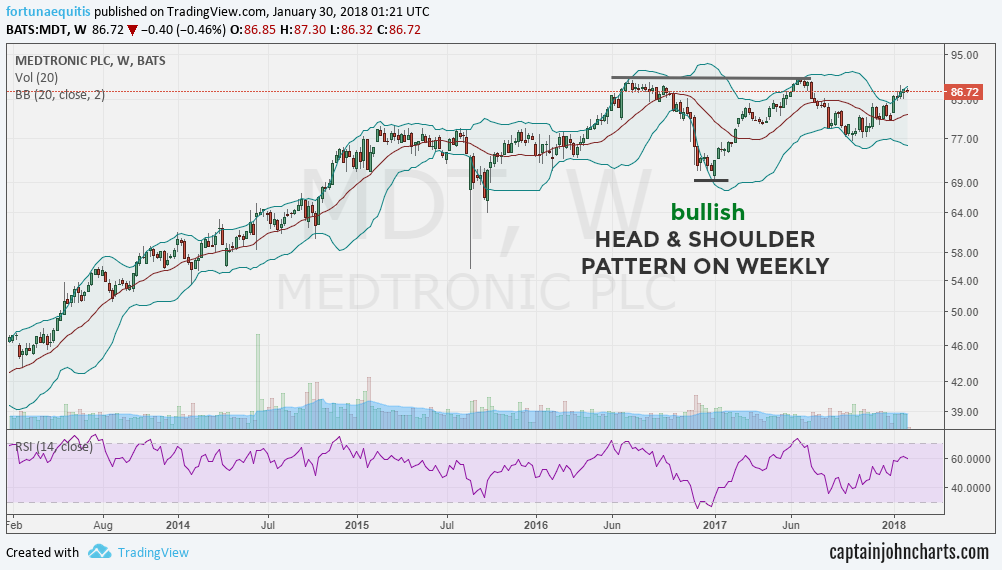
Now let’s look at a couple more angles from the “weekly” intermediate term timeframe.
WEEKLY CHART #1
Medtronic’s stock chart is making a bullish inverted head and shoulders price pattern.
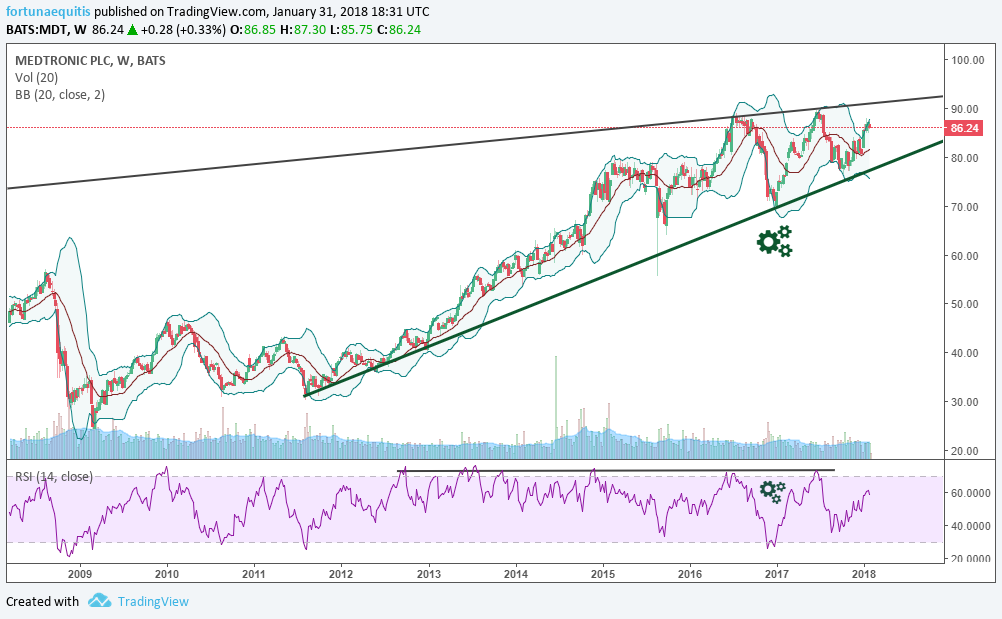
WEEKLY CHART #2
- The momentum as seen in the RSI at bottom (gray line) is the sell/bear zone. Touches to this no-no area result in loss of momentum and selling since Fall 2012.
- Expect price to possibly retest the trend line (green).
- The bullish pattern appears to be coiling after the long-term base breakout. It entered the triangle bullishly which suggests after such an extended period inside, a coiling and gearing up of momentum inside.
- At the green gear icons, I’ve pointed out 2 more bullish patterns. In the stock chart is an Inverted Head and Shoulders pattern and in RSI at bottom.
- The most recent RSI momentum since Fall of 2017 has whipped up bullishly and is not yet overbought.
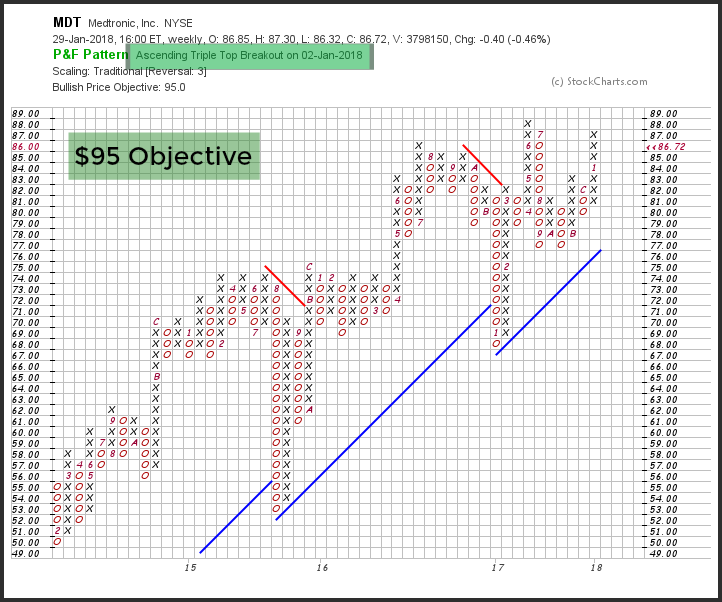
One more look here with a Point & Figure chart…
Medtronic Bullish Point and Figure Chart
- Riding nicely above the Bullish support and broke the bearish resistance.
- Bullish pattern: Ascending Triple Top Breakout Jan. 2, 2018.
- Bullish price objective: $95
Fundamentally Speaking
Their therapies improve the lives of 2 people every second, per their website.
Here’s a snapshot of their Business Revenue Mix:
- $10.5 Billion in revenue from Cardiac and Vascular Group. (35%)
- $9.9 Billion (35%) Minimally Invasive Therapies
- $7.4 Billion (25%) Restorative Therapies
- 1.9B (6%) Diabetes Group
They have a long consistent history of growing dividends and are a member of the S&P 500 Dividend Aristocrats with 40 yrs. of Increasing dividend per share. In fact, dividend per share CAGR over a 5-year period has increased 12% nearing $2.00 per share.
According to the Technical’s in the long and shorter term stock and point and figure chart’s, 2018 appears to be poised to see another breakout and set up to topple previous dividend earnings.
If you are interested in learning more about our investing approach and financial services, visit us at CaptainJohnCharts.
Twitter: @CptJohnCharts & @FortunaEquitis
The author may have a position in mentioned securities at the time of publication. Any opinions expressed herein are solely those of the author, and do not in any way represent the views or opinions of any other person or entity.


: Showing Some Signs of Emerging Strength")
