Backtests are an important price pattern for active investors to understand. Today I want to highlight a couple of recent trading backtests that failed and why they were important to risk management and understanding market behavior.
So What Is A Backtest?
A few years ago, I wrote a post on trading backtests that can serve as a great resource (so check it out). But in short, backtests can be bullish or bearish and occur after a key price support or resistance is broken. For instance, if a stock breaks out above $20 to the upside, it will likely come back to backtest the breakout level sometime shortly following the breakout. This backtest would offer a great risk-defined opportunity to go long. And alternatively, if a stock breaks down below $20, it may come back up to backtest the breakdown and offer a nice opportunity on the short side.
Backtests tend to occur due to the psychology of price. Whether in a short-term vacuum or a longer-term chart, the perception of “value” or “overextension” sets in briefly and pulls the security back to what I call “then scene of the crime” (the breakout or breakdown area). As will all technical or “price” related setups, it is about probabilities and risk management. Not all setups are successful and when they fail, it usually results in a “shakeout” and powerful move back the other way.
Two Recent Examples Of Trading Backtests: FXI & AAPL
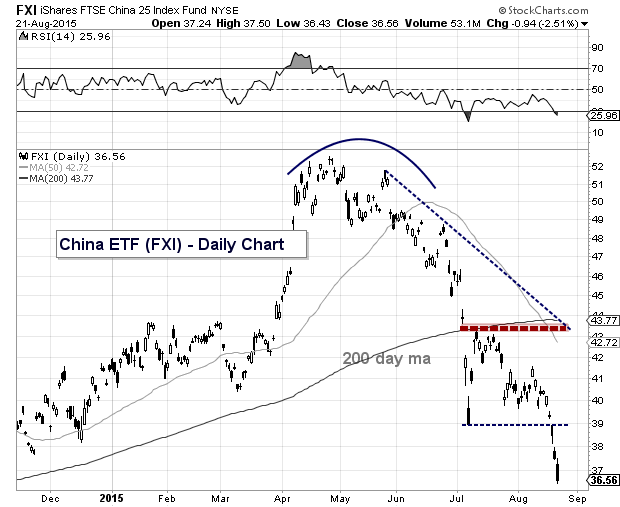
The first example is the China ETF (FXI). Due to the Chinese stock market crash, this ETF found itself in a “waterfall” that didn’t give many investors a chance. However, when it started to bounce, I highlighted a couple of bearish backtest levels to watch where I thought the rally would fail. Here’s the chart (notice the red dotted line where the rally failed.
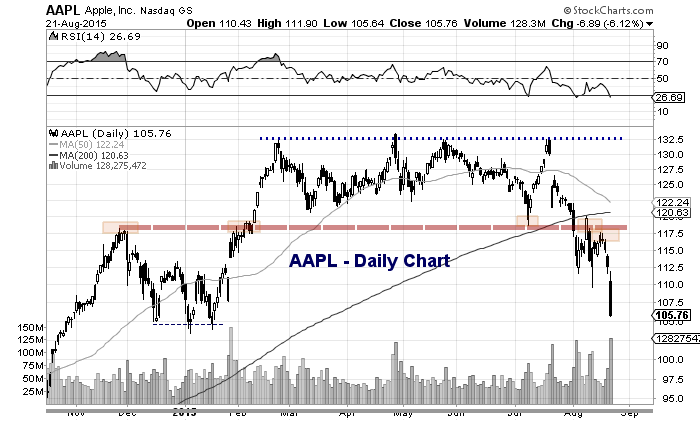
The second example is Apple, Inc (AAPL). The stock broke down through its 50 day moving average ($121) and lateral support at $118 earlier this month. But after it found it’s footing and bounced, I wrote a piece highlighting the potential for a bearish backtest of the 118-120 area. Sure enough, it failed just before it got there and sunk back to $105.76 to close the week. The chart below shows the breakdown (dotted red line).
The last point is that backtests sometimes offer forgiveness. If you are caught with a long position on a gap lower through a key support (i.e. breakdown), a backtest allows you a chance to lighten up.
I hope this short piece was helpful. Thanks for reading.
Sign up and receive our investing research and trading ideas in your inbox. No strings; it’s free.
Twitter: @andrewnyquist
The author does not have a position in any of the mentioned securities at the time of publication. Any opinions expressed herein are solely those of the author, and do not in any way represent the views or opinions of any other person or entity.

: Showing Some Signs of Emerging Strength")
