 Andy Nyquist’s excellent multi-timeframe review of the US Dollar Index’s (DX) now-historic run (currently working on 12 consecutive weeks higher) notes the seasonal challenges this advance confronts as we enter the month of October.
For the Euro – 56% of the US Dollar Index by weight – this couldn’t come at a more opportune time with a pivotal ECB policy meeting two days away. Likewise for those itching for a potential contrarian long play on the Single Currency via DX, benchmark Forex pair EUR/USD or alternate products such as the popular CurrencyShares Euro Trust ETF (FXE).
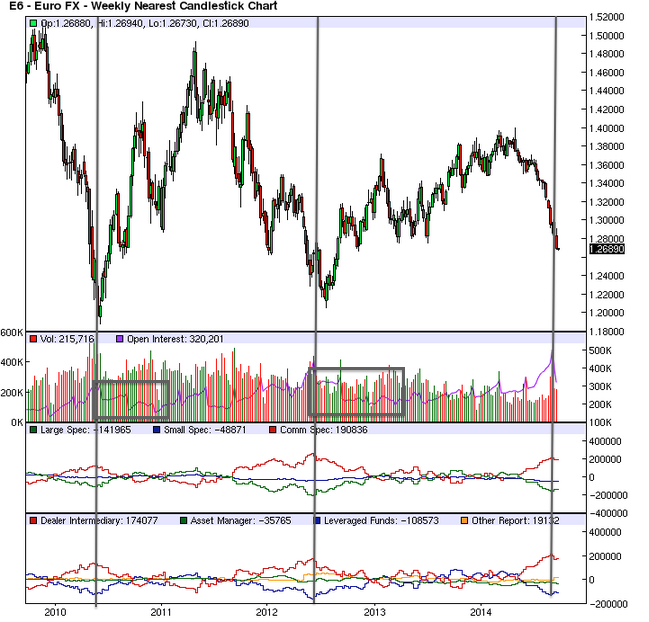
To begin, consider how traders are actually positioned (through last Tuesday) ahead of the meeting. Looking in on the Commitment of Traders positioning for CME’s Euro Futures (E6) contract, we note net positioning is negligibly off the record short trade that characterized the June 2012 Bottom, and exceeds the readings featured at May 2010’s low. Dealer Intermediaries – the contingent that makes of the majority of the aggregated “Commercial Speculator” category – remains record long on the hedge it has aggressively built since May, in contrast to the “Leveraged Funds” who have turned their speculative wheel as hard as possible into the ECB’s accommodative policy slide.
Zooming out a step, E6 Futures contract volume and open interest is instructive on this near-record short positioning. Like the current environment, Open Interest (OI) pushed higher on aggressive net negative volume in both 2010 and 2012, culminating in a local bull capitulation (vertical gray lines, below) as volume spiked to cyclical highs. Afterward, OI subsided as hedges reversed and speculative shorts were forced to cover (gray boxes).
In the past couple weeks, we are now seeing a similar pattern unfold.
As Nyquist noted in his post, the Euro is broadly oversold. In fact, RSI on the EURUSD weekly chart is lower than it has been since the Euro began trading in January 1999, requiring us to look as far back as the synthetic period (to 6 weeks in early 1997) to find a lower reading.
Preceding the May 2010 and June 2012 bottoms, EURUSD entered -21.5% and -19.4% declines before springing higher 12.4% and 9.4%, respectively. The momentum low in May 2010 preceded the price low by 3 periods, while momentum and price lows coincided in 2012. In both cases, the ensuing short-covering rallies occurred over 8 weeks. A similar occurrence (not visible in the COT data above) developed in late 2008 and early 2009 featuring a -23% drop followed by a 19.2% trough-to-peak spike across just 7 weeks.
EUR/USD – Weekly: Declines and Short-Covering Rallies, 2008-2014
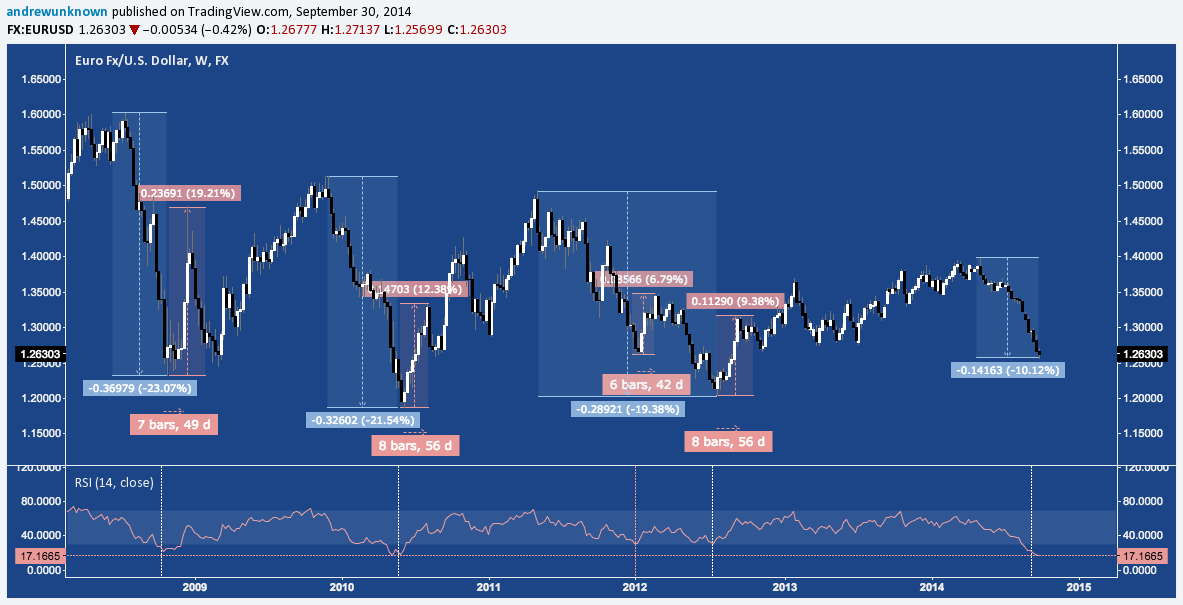
EURUSD’s current decline covers just half the range of those mentioned above. However each of those did include at least one intermediate dead-cat bounce or relief rally that modestly alleviated the pair’s oversold state before plumbing new depths. 2008’s decline was bisected by an 8% pop beginning in early September; 2010’s by separate 2.9% and 3.2% throwbacks in February and March; and 2011-2012’s had an 8.1% in October 2011, followed by a 6.8% rally in January 2012.
In contrast to each of these declines, the largest throwback in EURUSD’s current run occurred across 3 weeks in June, registering just +1.4% before rolling over.
Two scenarios seems probable from here, both of them including a Euro rally. The only question is: what will the rally’s staying power be?
- The Dead Cat Bounce (DCB): Under this scenario, EURUSD is for a brisk short-covering rally that fall apart as quickly as it develops, presaging new lows. The initial legs of the 2008, 2010, and 2012’s selloffs – the moves preceding the DCBs noted above – were -13.4% (15 weeks) -11.3% (12 weeks), and -11.9% (22 weeks), respectively. The current drop? -10.2% across 11.4 weeks. Here a rally would unfold to offset EURUSD’s bombed-out momentum and induce some reversion and reduced participation/volume in COT positioning before resuming the drop.
- The Bottom: In this case, EURUSD takes a cue from the 17.5-year low on it’s weekly RSI – lower than any of the occurrences noted above – and moves into a major rally of indefinite duration, but comparable to the measured moves higher that occurred between the 2008, 2010, and 2012 bottoms. Each of these rallies formed lower highs; but even staying consistent with this theme, EURUSD has room to rally up to 1.39 before turning again.
The fly in the ointment here is the third scenario derived from the 1997 outlier – this is where the Euro retakes very little ground and just continues plummeting. It’s inverse – the US Dollar Index – illustrates this well:
Nyquist pointed out that the US Dollar Index merely ambled sideways during the only period it has been more overbought in the last 20 years before pushing higher. Specifically, after digesting a 13-week, +10.3% move up with a 13-week Broadening Wedge, this “correction by time” resolved into a move very similar to the first, advancing +9.4% in 11 weeks to complete an +18.4% drive higher over 37 weeks.
US Dollar Index – Weekly: Examining 1997’s Record Weekly RSI Reading
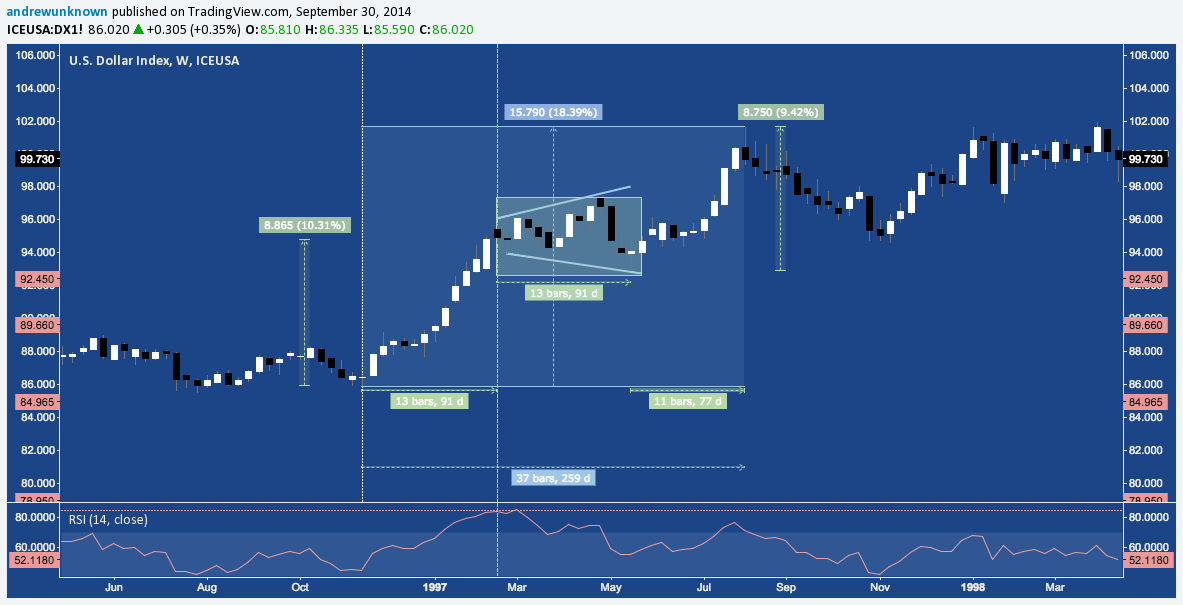
On the inverse, synthetic EURUSD (remember, this is before EUR began to trade in 1999) saw a -14% drop during DX’s 10.3% leg, consolidated as DX did and then saw a -10.5% drop over the final leg for a nominal -21% decline. If EURUSD follows a similar path this time, the first leg of it’s decline is over; but there will be little reprieve in the way of a throwback retracing its 3-month, 1300 pip dive before selling resumes in earnest.
Will Thursday’s ECB Spark a Euro Rally?
Could the ECB-authored monetary policy backdrop support a Euro rally (i.e. one of the first two scenarios described)? Some market participants may be very surprised.
The ECB’s Governing Council gathers this Thursday, October 2 for it’s latest policy meeting (check out FXStreet’s comprehensive preview to get up to speed). With Draghi’s declaration at September’s meeting that rates “are at the lower bound” focus turns to comments on the disappointing initial TLTRO round and the rollout of the ECB’s ABS and Covered Bond programs.
Whatever cues Draghi offers on these points on his subsequent press conference, there will also be an almost pathological focus (redolent of the Fed-watchers over the last 5 years in the US) on Draghi’s rhetoric for any hint the ECB may embark on QE, breaking with repeated invocations by Draghi and other Governing Council members of a Treaty-enshrined policy orthodoxy that precludes unsterilized purchases of member country sovereign debt.
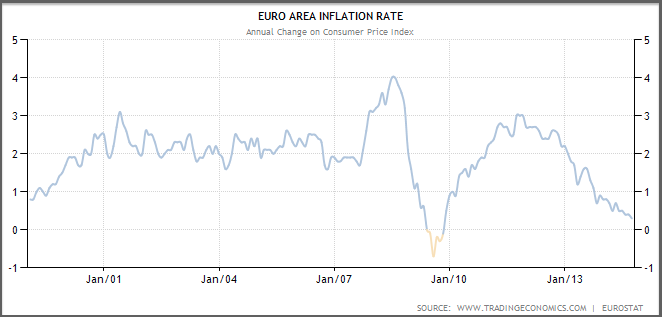
This occurs in a context where the ECB’s struggle to avoid the Euro Area’s “Japanification” – a long-term deflationary spiral – is widely perceived to be deepening, most recently affirmed with today’s latest Annualized HICP Flash CPI estimate coming in at levels consistent with the throes of the Great Financial Crisis:
Euro Area Annualized CPI — 1999-2014 (Single Currency Era)
Optimism from Draghi on Thursday about subsequent TLTROs and the efficacy of the yet-untested ABS and Covered Bond programs are the spark Thursday that could set off a violent short-covering rally in EURUSD. Any allusions – which are likely to remain vague, if they appear at all – to “additional measures” beyond these will be interpreted as an ECB capitulation to the necessity of QE under the crush pressure of unchecked disinflationary pressures and could mitigate enthusiasm over the ECB’s TLTRO and ABS measures. Any explicit references to the a Governing Council entertaining an LSAP program are sure to send the Euro aggressively lower.
On balance, the ECB is likely to proceed at a measured pace at Thursday’s meeting, hesitant to “go nuclear” with the introduction of full-blown LSAP before the incipient TLTRO and ABS programs have been given an opportunity to register their (in)efficacy as policy transmission mechanisms. Draghi is unlikely to effectively concede the failure or obsolescence of one program that has just begun and another that hasn’t even been introduced by obliquely referring to – much less rolling out – a far more ambitious program that will have strong detractors – viz., Bundesbank Chief Jens Weidmann among others – and is guaranteed to invite major legal challenges both in Brussels and before the German Constitutional Court in Karlsruhe.
As a result, unless Draghi is overtly pessimistic (which strains credibility given the context above), calculus for Thursday’s meeting seems to skew bullish for EURUSD.
After Thursday
None of this constitutes advice or a forecast: after all, a trader can easily go broke “trend following” policy regimes. However, it’s clear that whether or not Thursday prompts a major relief rally, the ECB’s policy is moving into deeper contrast with the Fed with every passing meeting, making the ECB’s trajectory (widely viewed as dovish relative to the Fed) important to a longer-term view of EURUSD.
Despite the perception of excitement that accompanies range expansion following record low volatility over the Summer, EURUSD’s (and thus, the US Dollar Index’s) major technical decision lies ahead. EURUSD is only 400 pips above it’s June 2010 close at 1.2235, the lowest monthly finish for the pair since March 2006. This level is crucial long-term horizontal support, made even more important because it is in confluence now EURUSD’s Symmetrical Triangle rising trend line support.
EURUSD – Monthly: Nearing Symmetrical Triangle Support on Near-Record Volatility Compression
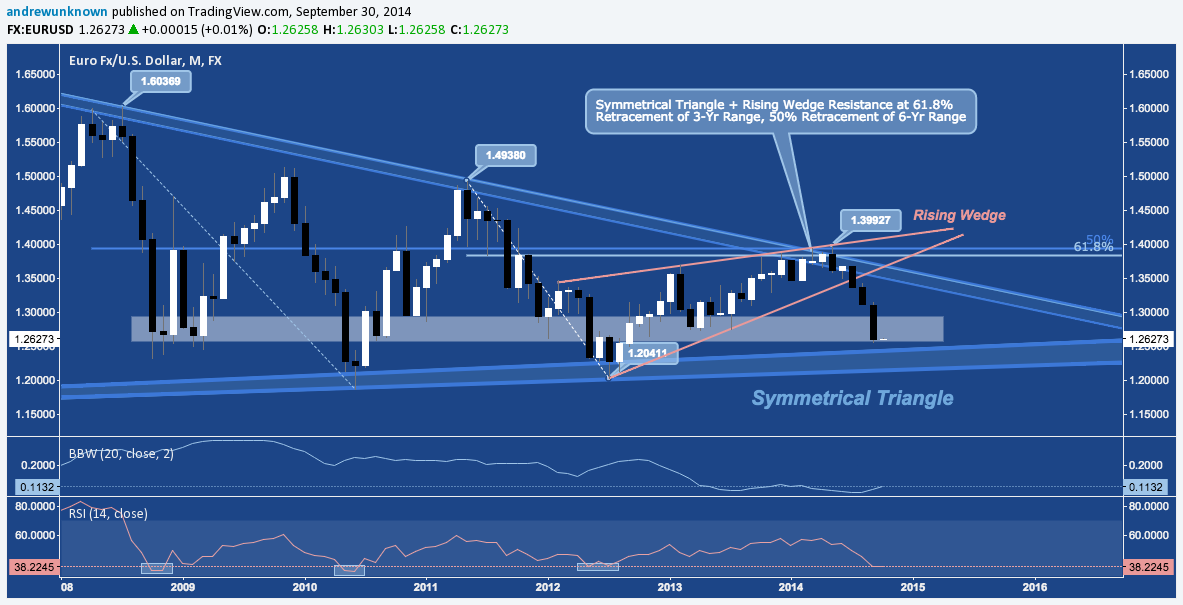
EURUSD’s long-term range (as measured by Bollinger Bandwidth in the lower panel) remembers just off record lows. Coincident with Monthly RSI readings that have accompanied the pair’s major bottoms in this study, medium-to-long term appraisals of momentum all sync to suggest a coming turn higher. As we covered above, there are arguments suggesting this may be short-lived or sustained. Whatever the case, the EURUSD is funneling into a technical resolution years in the making.
Twitter: @andrewunknown
Author holds no exposure to asset classes mentioned at the time of publication. Commentary provided is for educational purposes only and in no way constitutes trading or investment advice. E6 COT chart courtesy barchart.com. Editor’s Note: “Guardian Council” amended to “Governing Council”.

: Showing Some Signs of Emerging Strength")

