Small cap stocks are a higher beta plays for investors. Simply put, they carry more risk.
Therefore, when small cap stocks are out-performing, they underscore a “risk-on” environment for investing.
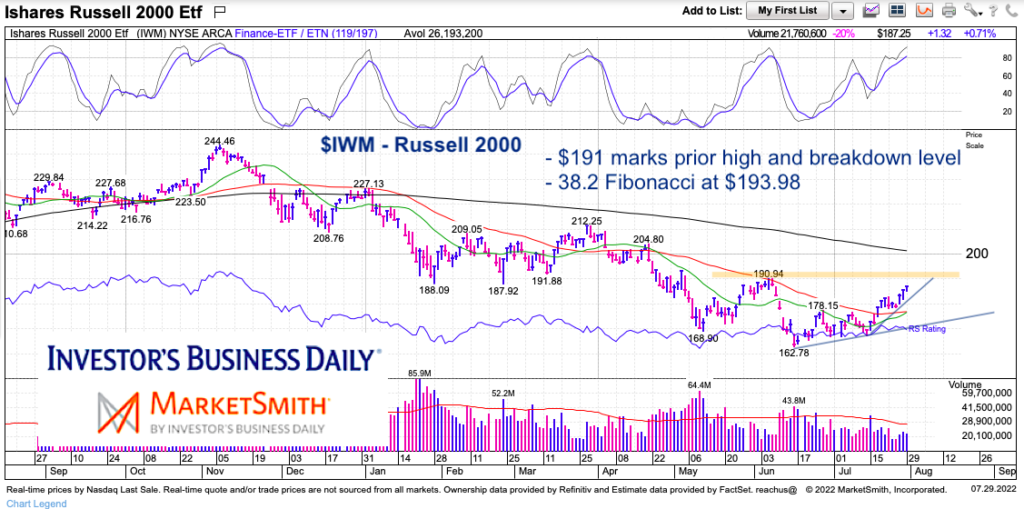
Today, we highlight the near-term chart for the Russell 2000 ETF (IWM).
The small caps ETF is nearing important resistance that could be very telling for investors. Breakout and the rally may have “legs”… breakdown and it may be over.
Note that the following MarketSmith charts are built with Investors Business Daily’s product suite.
I am an Investors Business Daily (IBD) partner and promote the use of their products. The entire platform offers a good mix of analysts, education, and technical and fundamental data.
$IWM Russell 2000 ETF “daily” Chart
The $191 to $194 price area appears to be strong short-term resistance. This area comprises of the June high as well as the 38.2% Fibonacci retracement of the all-time high to this year’s June low.
Will it be rally on? Or weakness just ahead?
Twitter: @andrewnyquist
The author may have a position in mentioned securities at the time of publication. Any opinions expressed herein are solely those of the author, and do not in any way represent the views or opinions of any other person or entity.
: Creating Bullish Divergence?")


 and Semiconductors (SMH): Concerning Price Pattern?")


