The guys at StockTwits posted on Tumblr a great list of seven charts on the topic of NYSE margin debt. They were kind enough to include a chart I did, but it also got me thinking and I decided to dig in a little more myself on this seemingly endless debate.
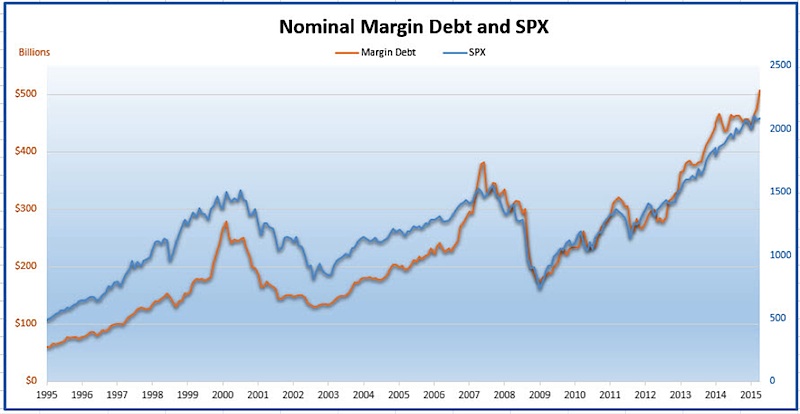
In case you hadn’t heard, margin debt just made a new all-time high. Many say this is a warning that way too many investors are over-the-top bullish and at the first sign of stock market weakness it could lead to a cascade of margin calls, market crashes, etc.
Well let’s take a look at some charts. Note SPX is the S&P 500.
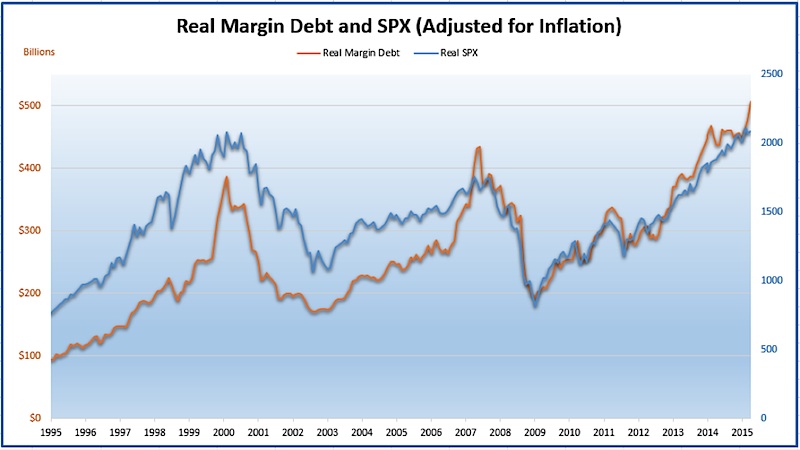
Here’s that same chart, but adjusted for inflation.
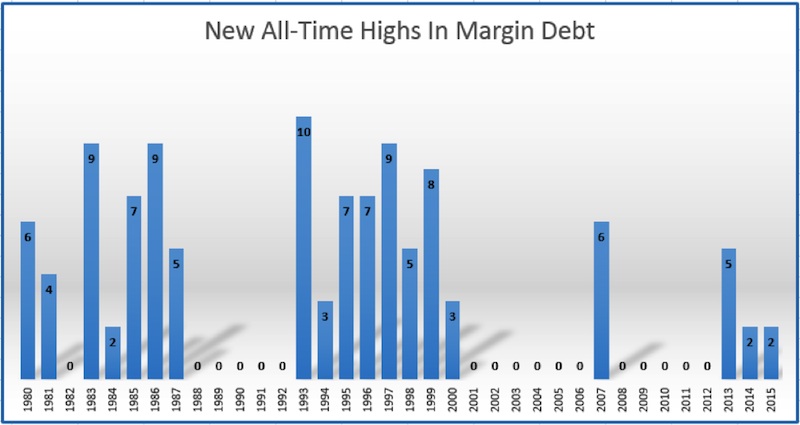
There is no question margin debt is high, but as I’ve said for years during this bull market – the trend is up, I’m not smart enough to know when it’ll end. I’ve long been in the camp that the overall trend of margin debt is what matters. Once it rolls over from a high level, then that is the warning sign you should be worried about. Margin debt making new highs is actually a normal and bullish thing.
I went back to 1980 and found that 26% of all months saw a record high in margin debt. Not to mention, the new highs tend to happen in clusters. Below I broke things down by how many new highs (out of 12) were made each year. We’ve seen two major clusters and very well could be working on the third. Who’s to say we don’t have another few years of more new margin debt highs? I’m not betting against it is my take.
I compare the endless margin debt worries to this awesome chart that was circulated recently in honor of mosquito week. We see sharks as these ruthless killers, but in fact, they only kill about 10 humans a year. Elephants kill ten times more than that, heck fresh water snails kill a thousand more times as many people as sharks. In the end, the top killer of people per year is mosquitoes, which kill more than 700,000 per year. I never would have guessed that until I saw this chart.

I think margin debt is like sharks, it gets a lot of press and pub, but really isn’t this huge worry that we all make it out to be. The real worries are the ones we don’t see coming. Everyone (and I mean everyone) is talking about high margin debt, which probably means it isn’t going to matter much. We dissected the meaning of Fiscal Cliff the whole second half of 2012 and once it came and went, 2013 was a record year. So if everyone is talking about it, maybe we should be looking for other things that matter. It is probably already priced into things.
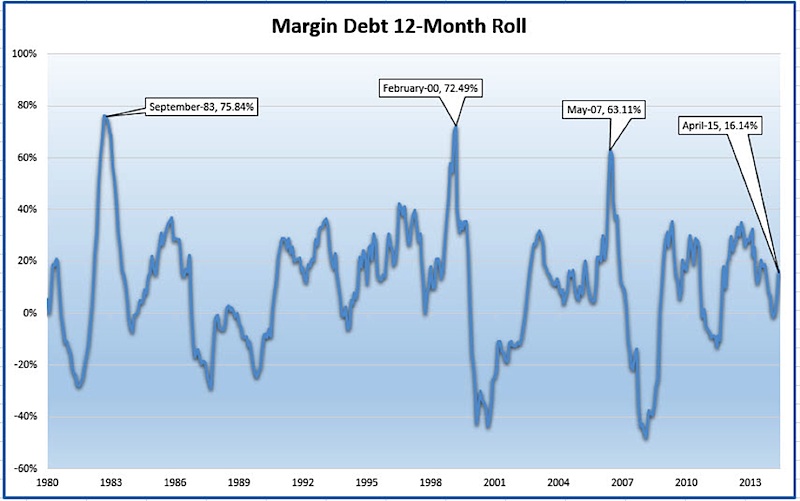
Another way I like to look at margin debt is by how much it has moved over the previous 12 months. We have seen huge moves higher in margin debt at previous peaks. That makes sense, when people are truly excited and bullish, they pile on the margin. As below shows, we aren’t anywhere near previous peaks yet. So maybe people aren’t raging lunatic bulls, just buying everything they can as many bears make high margin sound like.
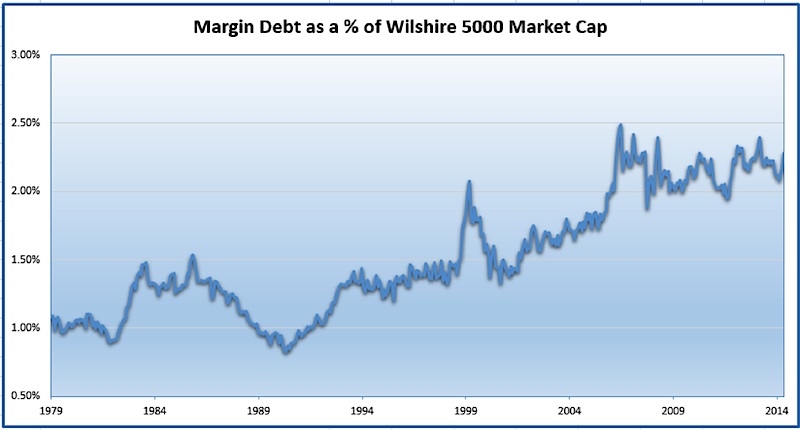
Lastly, here’s a more apples-to-apples comparison of margin debt. I found the market cap of the Wilshire 5000 (so pretty much the US stock market) and how much margin debt was compared to that. Currently, margin debt is 2.28% of the overall market. This is above the 2000 peak, but not above the 2007 peak. This is just another way to show, yes margin debt might be high, but is it truly this off-the-charts high level? I’d argue no, not yet at least.
So be on the lookout for a huge sudden jump in margin debt, or for margin debt to roll-over. Until then, worry more about the snails and mosquitoes to your portfolio and don’t lose sleep over the sharks.
Good luck and happy trading.
Twitter: @RyanDetrick
No position in any of the mentioned securities at the time of publication. Any opinions expressed herein are solely those of the author, and do not in any way represent the views or opinions of any other person or entity.


")
")


