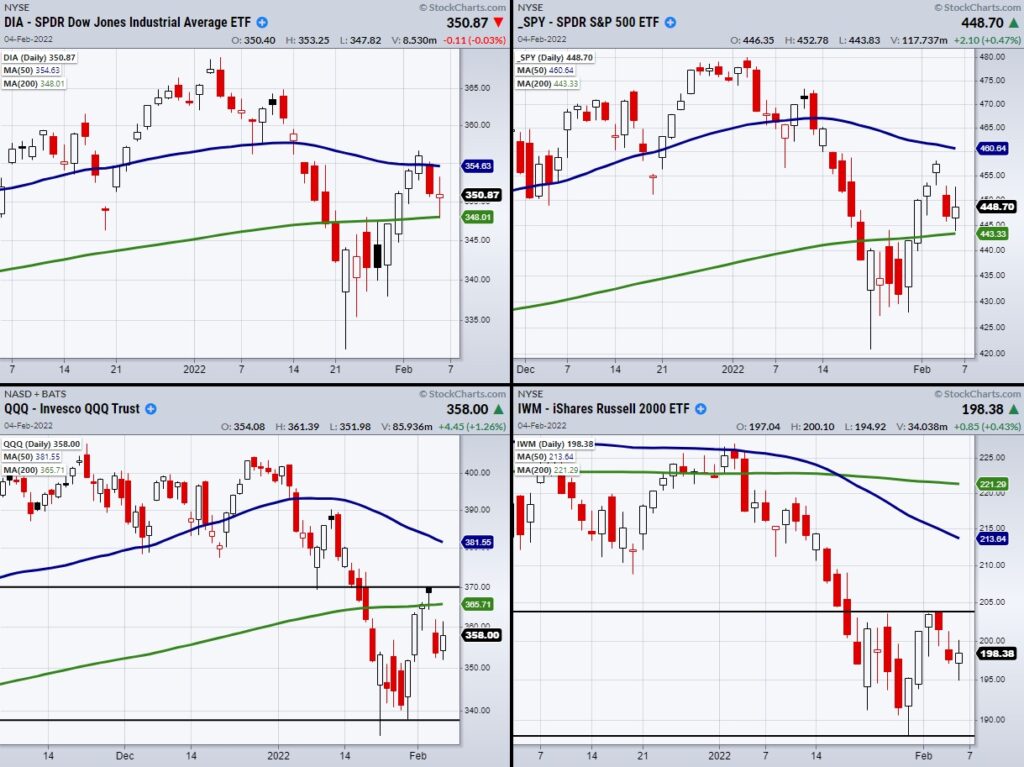
Friday ended on a positive note with the Dow Jones (DIA) and the S&P 500 (SPY) holding over their 200-day moving averages.
Alongside, Bitcoin has cleared 40k and is currently looking for 41k next.
However, High Yield Corporate Debt (JNK) gapped lower Friday creating a key area to watch for underlying market strength or weakness.
The above chart shows how the DIA and SPY were both able to hold their 200-day moving averagess while the Nasdaq 100 (QQQ) and the Russell 2000 (IWM) sit near the middle of their current trading ranges as seen from the black lines.
While the major indices have key levels to clear and hold, we can also use JNK as an indicator based on investors’ willingness to take on risky corporate debt.
What makes JNK so useful is its potential large blowoff bottom it made Friday after gapping down.
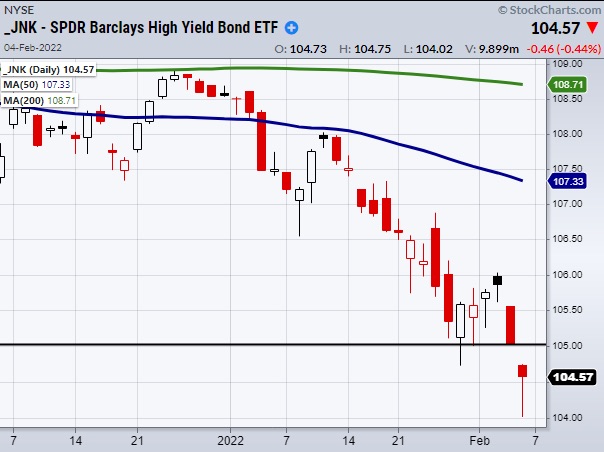
Now we can watch for a reversal pattern based on it clearing the gap at $105.02.
However, If JNK stays under Thursdays low, the stock market could still have more chop or consolidation to get through.
On the other hand, if JNK clears $105.02 we can look for short-term buying opportunities, along with watching for key resistance levels in the indices to clear.
Stock Market ETFs Trading Analysis & Summary:
S&P 500 (SPY) 461 is price resistance. Watching to see if it can hold the 200-day moving average at 443
Russell 2000 (IWM) 203.90 to 188 is the current trading range.
Dow Jones Industrials (DIA) needs to hold 350.
Nasdaq (QQQ) 356 to clear.
KRE (Regional Banks) Watching for second close over the 50-day moving average at 72.19
SMH (Semiconductors) 287.73 is price resistance, 270 price support.
IYT (Transportation) Failed the 200-day moving average at 262.
IBB (Biotechnology) Watching to see if it can hold over the 10-day moving average at 129.53.
XRT (Retail) 83.54 is price resistance, 75.62 price support.
Twitter: @marketminute
The author may have a position in mentioned securities at the time of publication. Any opinions expressed herein are solely those of the author and do not represent the views or opinions of any other person or entity.


 Flirting With Critical Support… Again")

