Interest rates are on the rise as inflation confounds (and astounds… and crushes) everyday people.
With the Federal Reserve behind the curve, they are expecting to make a big move next week.
Looking at the 10-year bond yield, we can get a better idea of where rates are at now and perhaps how high they will go.
We can do this by highlighting some guideposts where interest rates may pause or stop going up. Let’s take a look at a long-term chart.
Note that the following MarketSmith charts are built with Investors Business Daily’s product suite.
I am an Investors Business Daily (IBD) partner and promote the use of their products. The entire platform offers a good mix of analysts, education, and technical and fundamental data.
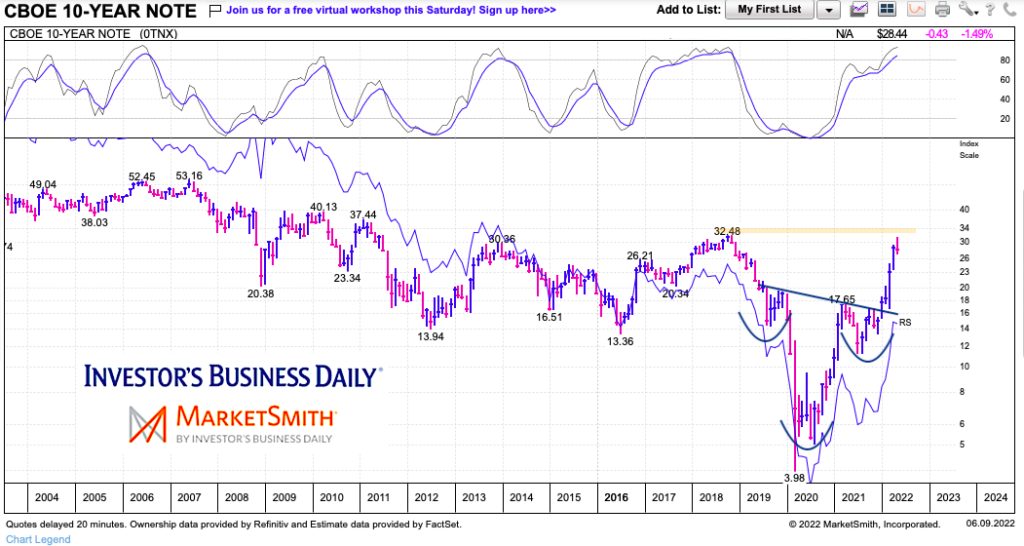
$TNX – 10-Year US Treasury Bond Yield “monthly” Chart
As you can see, bond yields have been on fire. The rally has spurred interest rates much higher, causing major concerns for housing and auto sectors as well as the economy.
Inflation is a demon… and one that many forgot about. Well it’s here.
In the chart below, we can see the surge in bond yields. The latest surge has come out of an inverse head and shoulders pattern. The measurement ties to current resistance in the 3.2 to 3.5 zone. Note that I give a little wiggle room due to two reasons: market volatility and this is a weekly chart.
I’m looking for a pause soon. But when we breakout higher again (and I believe we will), look for 4% and 5.3% areas as next resistance.
Twitter: @andrewnyquist
The author may have a position in mentioned securities at the time of publication. Any opinions expressed herein are solely those of the author, and do not in any way represent the views or opinions of any other person or entity.
: Creating Bullish Divergence?")


 and Semiconductors (SMH): Concerning Price Pattern?")


