An Indicator of Peril
Thanks to Jesse Felder, we recently stumbled upon a measure of economic conditions that has reliably signaled every recession since 1948. The data point, Real Value Added, is currently in negative territory and may, therefore, be a harbinger of an economic downturn. If it is a false signal, it would be the first in a 70-year history of observations.
720Global does not rely on any one data source to determine the pace of economic activity or to formulate recession probabilities. Instead, we analyze data from many different sources to help better understand the likely path of the economy. That said, when a single data source has an indisputable track record, we take notice and look for other corroborating evidence and bring it to your attention.
Gross Value Added (GVA) and Real Value Added (RVA)
GVA is a measure of economic activity, like GDP, but formulated from the production side of the economy. It measures the dollar value of all goods and services produced less all the costs required to produce those goods or services. For example, if 720Global buys $100 worth of wood, $20 worth of other materials and employs $30 worth of labor to build a chair, we have produced a good for $150. If that good is sold for $200, 720Global has created $50 of economic value.
Gross Domestic Product (GDP), the more popular measure of economic activity, calculates the level of commerce based on the dollar value of the final goods and services produced. It may help to think of GDP as economic activity measured from the demand side and GVA as measured from the supply side. Despite the differences, the levels of economic activity reported are remarkably consistent. Since 1948, nominal GDP has averaged annual growth of 6.55% while GVA has averaged 6.50%. It is important to note that, while they track each other very well over the longer term, they are less correlated quarter to quarter.
Economists prefer to measure economic activity without the effect of inflation. If inflation were rampant when making the chair in the example above, some of the incremental value was due to the general trend of rising prices and not value added by 720Global. To strip out the effect of inflation and compute a pure measure of value added, it is commonplace to subtract inflation from GVA. The result is Real Value Added (RVA = GVA less CPI).
Charting RVA
The graph below plots RVA since 1948. Periods deemed recessionary by the National Bureau of Economic Research (NBER) are denoted in gray.
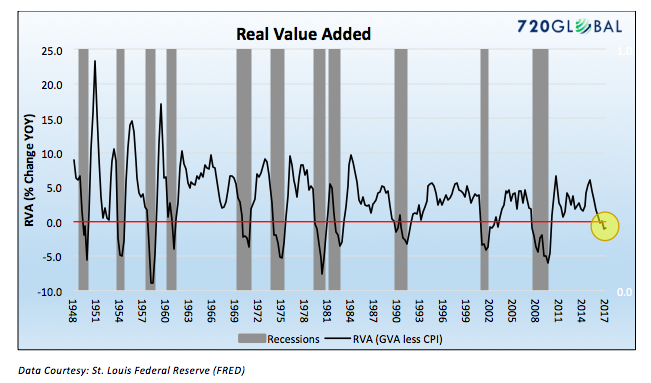
Since 1948 there have been 277 quarters of data. RVA has only been negative during recessions or in proximity to periods leading up to and/or following recessions.
ALSO READ: 22 Troublesome Facts About This Market
Summary
Currently, three of the last four quarters have produced negative RVA levels. Real GDP is not producing similar results, having averaged 2% growth over the same quarters. As mentioned earlier, RVA and Real GDP may not be well correlated over short time frames.
RVA is just one source of data arguing that economic trouble lies ahead, therefore, we would be wise not to read too much into this one indicator. Of concern, however, is that negative RVA readings have an impeccable pattern of signaling recession as a coincident indicator. Will this time be different? If not, then we would expect to see other economic indicators reflect similar weakness in the weeks and months ahead. Clinically, our efforts focus on finding valuable data that will allow us to help clients make prudent decisions. This is certainly one such piece of data.
Twitter: @michaellebowitz
Any opinions expressed herein are solely those of the author, and do not in any way represent the views or opinions of any other person or entity.


 and Semiconductors (SMH): Concerning Price Pattern?")


