There has been much talk of “transitory inflation”, but the evidence is starting to suggest the term may overstay its welcome.
The Fed chose the word “transitory” to describe this instance of rising prices because of its imprecision. Transitory can denote hours, months, or decades. Using transitory versus a specific period provides the Fed freedom to be wrong but be grammatically correct.
While the Fed uses ambiguous words, Mr. Market may have more defined expectations. If investors grow impatient with the Fed’s transitory, bond markets may react. In such a case, how will the Fed respond to “enduring” or “lasting” inflation coupled with higher yields? If they are already tapering, will such conditions push them to speed up their pace?
Conversely, recent data shows inflation may be stabilizing. Maybe the Fed is correct, and inflation rates will normalize in the coming months. If so, will they hold off on tapering or reduce the rate of tapering?
In July, we wrote Just How Transitory is Inflation? The article is a deep dive analysis of CPI. At the time, we sought a better understanding of what was causing inflation to rise. With two more months of inflationary data, an update is essential.
Understanding inflation beyond the headlines helps us answer the all-important question: Just how transitory is transitory? From there, we can begin to assess potential Fed and market reactions.
Headline CPI Summary
In the latest CPI report, covering August, the monthly CPI figure rose by 0.3% or 3.6% annualized. The year-over-year rate is +5.30%. In comparison, June’s monthly CPI rose by 0.90% or nearly 11% annualized. Despite the big difference in monthly rates, June’s year-over-year change of +5.40% is only 0.10% higher than August.
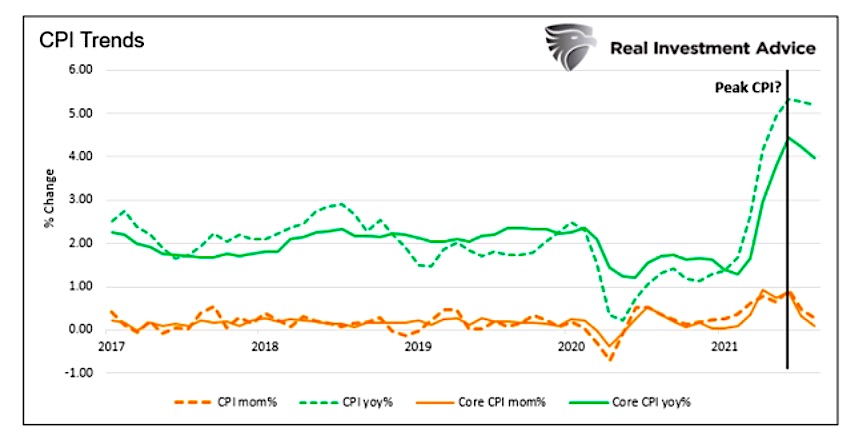
As shown, the monthly CPI and core (excluding food and energy) are turning lower. While not as pronounced, the annual data is following suit. Two months does not make a trend, but it appears to be fulfilling the transitory definition. Core CPI, at +0.10% last month, is 0.10% below the average for 2017-2019. Headline CPI is only 0.10% above the average.
The headline data is supportive of the transitory narrative; however, it does not tell the whole story.
The Breadth of CPI
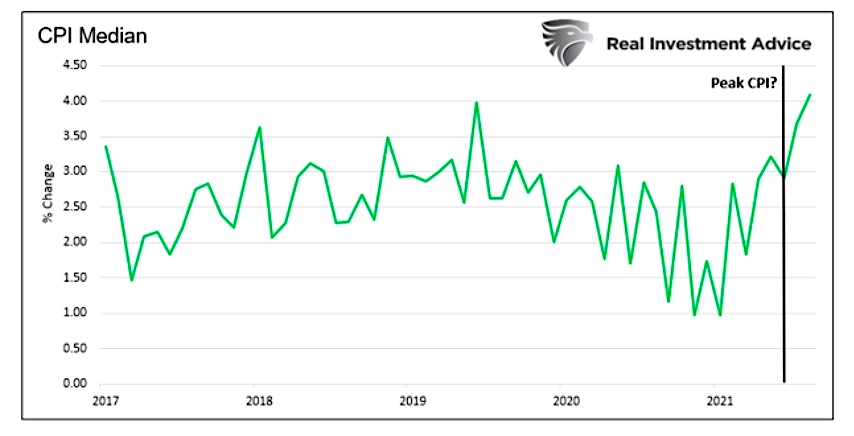
Digging deeper into CPI and looking beyond the headline averages may not support the word transitory. The graph below shows the CPI Index based on the median price of the goods and services in the index. Unlike the headline CPI Index, median CPI is still rising and at the highest level since 2008.
The distribution graph below compares June to August regarding how the prices of all the underlying goods and services within CPI are changing on an annual basis. We separate the data into 2% price buckets.
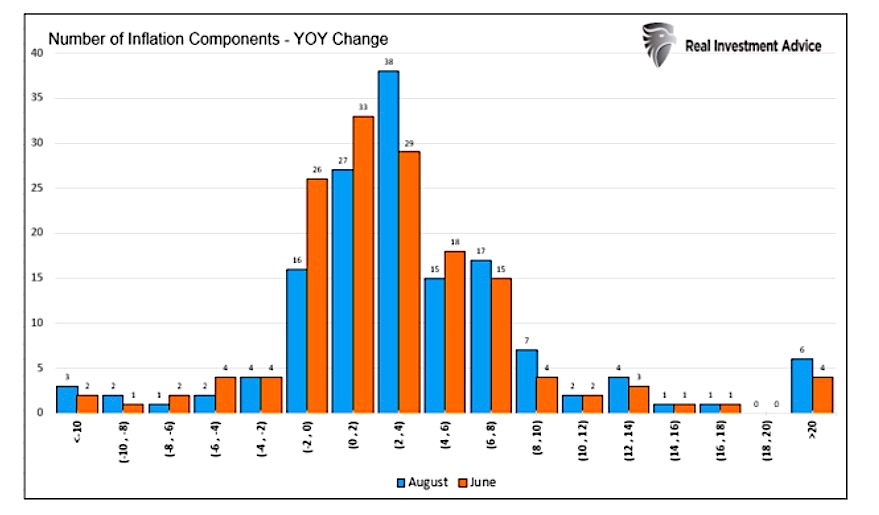
The blue (August) and orange (June) bars comparing the two months may look somewhat similar, but there are differences worth discussing.
In June, 75% of the CPI components were rising at a rate slower than the 5.4% inflation rate. In August, 71% were rising at a slower rate than the 5.3% rate of inflation.
The number of goods whose prices rose between 2% and 10% increased from 66 to 77. The number of goods whose prices rose by 2% or less fell from 72 to 55. While subtle in the graph, the number of goods shifting to the right (more inflation) is noteworthy.
52 of the goods and services have price declines from June to August. Six were unchanged, and 95 had price increases. Again, more goods are rising in price than falling.
The breadth of the market is not supportive of the transitory theme. A wide swath of prices are broadly rising, albeit not at an alarming pace.
Outliers
In the original article, four goods had year-over-year price changes of greater than 20%, as shown below.
- Used Cars 45.2%
- Gasoline 45.1%
- Fuel Oil 44.5%
- Other Motor Fuels 32.1%
In the August report, six goods had greater than 20% increases. The four goods from June maintain annual 20% rates of inflation. Added to the list are propane and utility services.
The inflationary outliers continue to be energy and auto-based. Both are rising in large part due to the reopening of the economy and supply disruptions. We expect both will moderate in the coming months. As this occurs, they will put less upward pressure on the CPI Index.
Employee and school cafeteria food prices are down well below 20%. Over time these should moderate as schools and offices come online. Such will result in inflationary pressures.
Big Contributors
In June, 92% of CPI was due to the price changes of the ten largest index weightings, as shown below. Those ten goods played slightly less of a role in August, contributing 82% to the change in the index. Below is a comparison of the same ten contributors for June versus August.
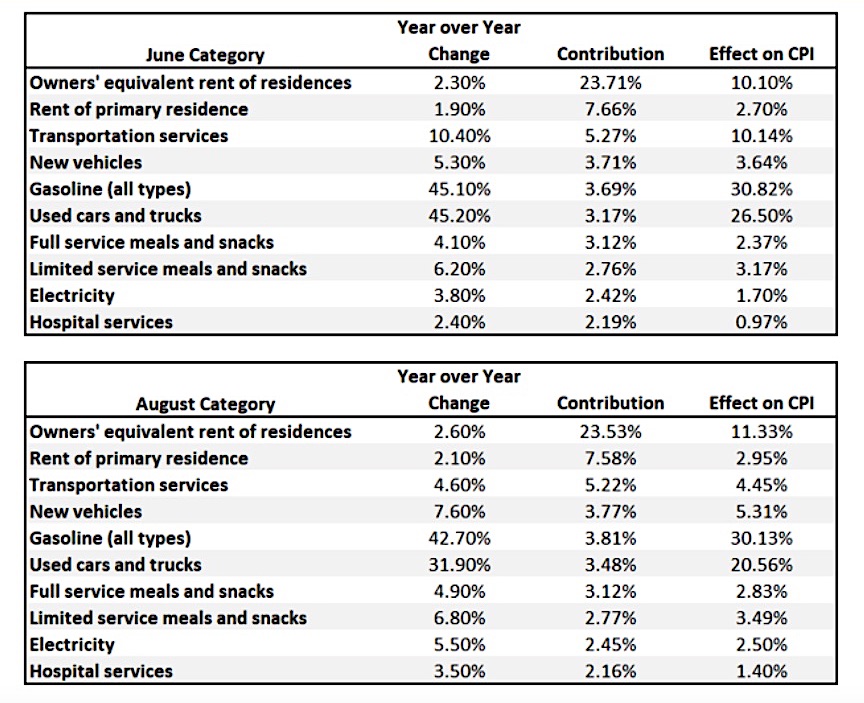
The prices of Used Cars and Transportations rose at a lesser rate than June, but every other category was little changed.
In the original article, we warn Shelter prices are the most considerable risk to more inflation. Driving our concern is Shelter’s 30%+ contribution to CPI and rapidly rising home and rent prices. As we show above, higher home and rental prices are barely making their way into CPI.
What gives?
In our article BLS’ Housing Inflation Measure is Hypothetical Bull****, we stated: “It appears impossible to calculate the BLS version of OER or rent.”
We remain concerned that a double-digit increase in rent and home prices (OER) will push Shelter prices higher in the months ahead. However, history proves reality, and the BLS Shelter measure has a near-zero correlation.
Flexible Prices
As we wrote in June, CPI tends to be heavily correlated with goods and services that have flexible prices. These are goods like gasoline, whose prices tend to fluctuate both up and down. The Atlanta Fed publishes data on flexible and sticky prices, as shown below.
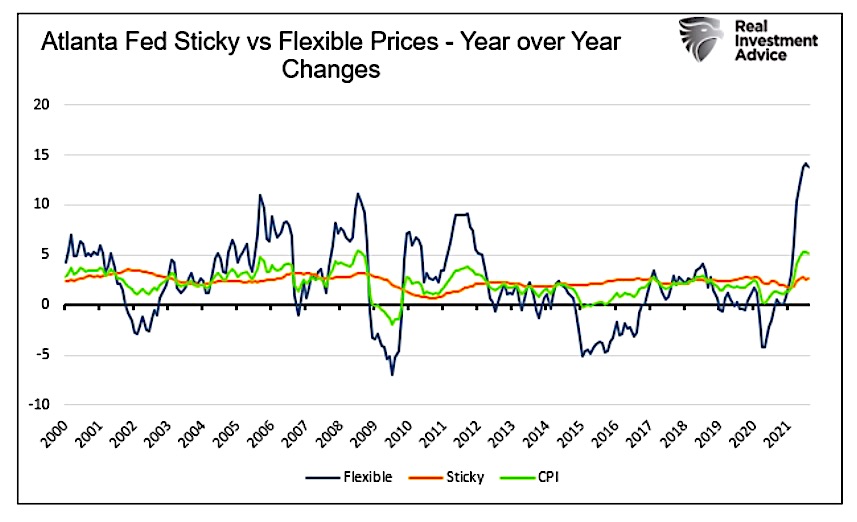
The graph shows sharp increases in both flexible and sticky-price goods are leveling off over the last two months. Given the Atlanta Fed measure of flexible prices has a 96% correlation with CPI, we are hopeful the upsurge is halting.
Expectations
The graph below shows a glaring divergence between Wall Street inflation expectations and those of Mom and Pop. Five and ten-year market-implied inflation expectations have been stable since January. All the while, the University of Michigan survey of consumers sees steadily rising inflation expectations.
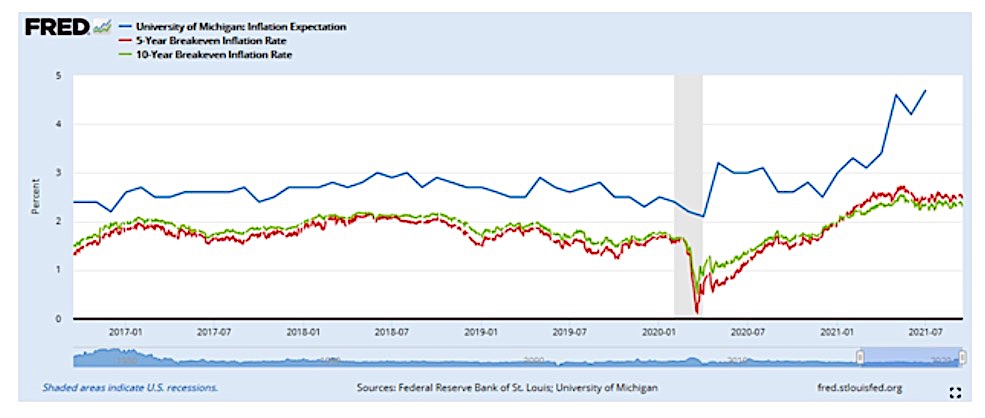
While Wall Street buys into the transitory theme, consumers are not. This divergence matters as personal consumption drives about two-thirds of economic activity.
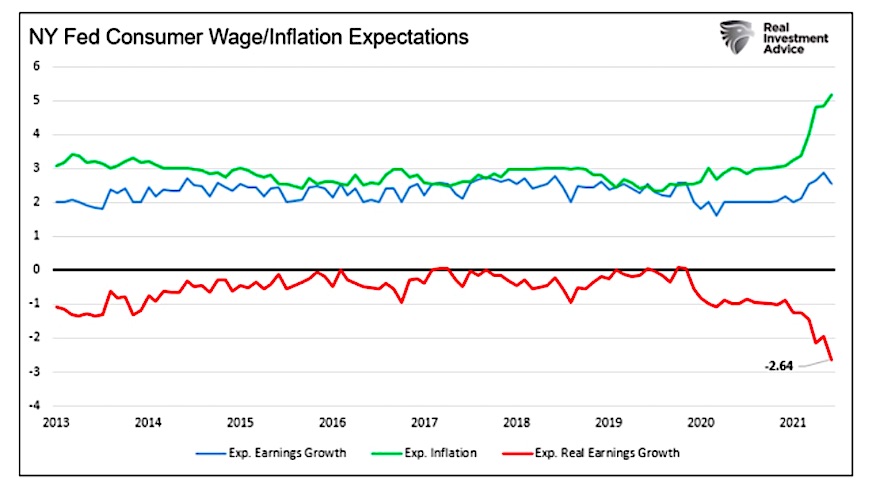
The New York Fed, via their latest Consumer Expectations Survey, highlights why confidence is weak. Per their survey, expected inflation is now over 5% and rising. At the same time, expected wage growth is 2.5% and stable/falling. As a result, consumers expect to lose 2.64% (red line) in purchasing power over the next year. Would you be confident taking a 2.64% pay cut?
Summary
We are witnessing unprecedented pressures on the supply and demand side of pricing equations. Forecasting, with such uncertainty, is challenging. As such, we maintain a humble approach to inflation forecasting.
The latest round of data provides some evidence inflationary pressures are abating. However, the breadth of the data tells us there are still many goods and services still rising in price. This difference may help explain why consumer inflation expectations are higher than the market’s and confidence is falling.
Just How Transitory is Transitory? We suspect the market will have its answer in the next few months. Prolonged rising or high inflation beyond December will likely get many to question if inflation is truly transitory. Until then, pay attention to headline inflation, the breadth of the data, and especially any effects from rising Shelter prices on CPI.
Twitter: @michaellebowitz
The author or his firm may have positions in mentioned securities at the time of publication. Any opinions expressed herein are solely those of the author, and do not in any way represent the views or opinions of any other person or entity.

: Worrisome to Broader Market?")

