The common refrain, “Sell in May…” gives this month a bad rap, but it doesn’t deserve it.
May is historically one of the least volatile months of the year as measured by its closing average return in the S&P 500 Index. Since 1970 its average return is only .49%.
Considering December, January, and April are three of the top four best performing months of the year, the market probably deserves a rest by May.
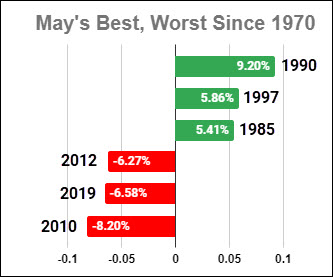
However, May doesn’t always rest, and it’s not lacking in historical volatility, as you can see from the chart above of the best and worst performing months of May in the last 50 years.
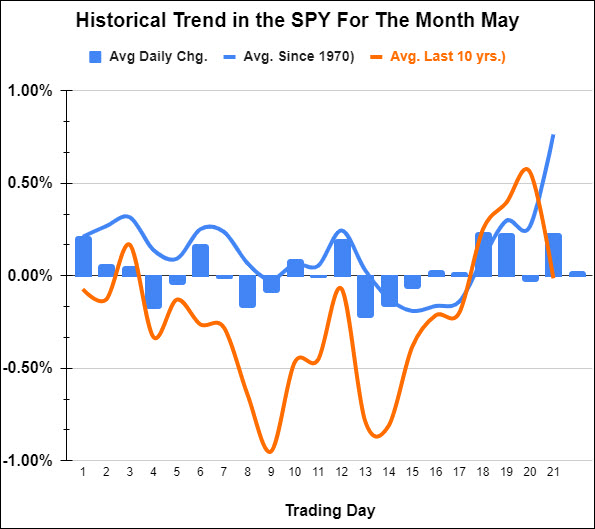
There’s also an interesting historical trend in May’s performance intra-month. It tends to be weak to start, then rally in the latter part of the month.
Interestingly, the patterns over the last 10 and 50 years are similar in that, May has tended to bottom around the same day of the month in both time frames.
As you can see in the chart below, the trends of both the red line (10 years) and blue line (since 1970) both bottom out around the 13-15th trading day of the month.
The 13th trading day of the month will be May 17th.
With a Fed announcement, earnings from AAPL, and an employment report all this week, May could get off to a wild start.
If history is any guide, and the market pulls back this week, look for a bounce around the 9th trading day of the month (May 11th) and then a rally into the end of the month starting after May 17th.
Stock Market ETFs Trading Analysis & Summary:
S&P 500 (SPY) 23-month MA 420
Russell 2000 (IWM) 170 support – 180 resistance
Dow (DIA) Over the 23-month MA-only index
Nasdaq (QQQ) 329 the 23-month MA
Regional banks (KRE) 43 now pivotal resistance
Semiconductors (SMH) 246 the 23-month MA
Transportation (IYT) 202-240 biggest range to watch
Biotechnology (IBB) 121-135 range to watch from monthly charts
Retail (XRT) 56-75 trading range to break one way or another
Twitter: @marketminute
The author may have a position in mentioned securities at the time of publication. Any opinions expressed herein are solely those of the author and do not represent the views or opinions of any other person or entity.


