We are so excited that Stockcharts.com is now offering you our ACP plugins.
We had to write about it for today’s Daily especially since you can read anywhere the thousands of differing opinions on what Powell said today and the implications for the market.
These indicators are the crux of our trading decisions.
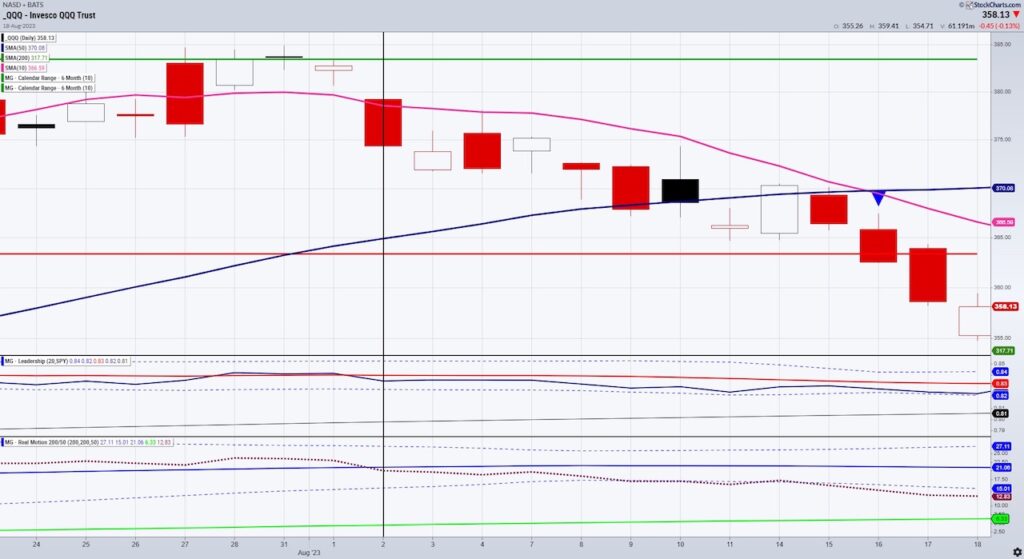
Note the vertical line drawn on the chart for August 2, 2023.
This is just one example of how the 3 indicators told you exactly what was happening in NASDAQ 100 or the QQQs.
The newest ACP plug in is the 6-month calendar range. We also have the one-month calendar range available. For today though, we are focusing on 6-months.
The Daily has covered the July 6-month calendar range reset A LOT since mid-July.
Why?
Because in January, how the varying instruments traded up down or around the 6-month trade told us who would lead and who would lag. It worked extraordinarily well.
In this QQQs chart, on July 31st, QQQs made a run for the green horizontal line (July 6-month high) and failed to stay above it the next day.
On August 2nd, QQQs gapped down thereby failing to clear the key 6-month range high.
If we follow the vertical line down, next you see is the Leadership indicator or how an instrument performs against the benchmark.
On August 2nd, QQQs began to underperform the SPY.
This alongside the failure of the calendar range was a heads up that a sell off was coming.
The chart on the bottom is the Real Motion or Momentum chart.
On August 2nd, momentum broke down under the 50-DMA (blue line) while prices were above their 50-DMA. This told us we were having a bearish divergence in momentum versus price.
Had you sold either your longs or gone short at around 375, by Augst 18th, the QQQs traded down to 354.71 breaking the July 6-month calendar range low (red horizontal line).
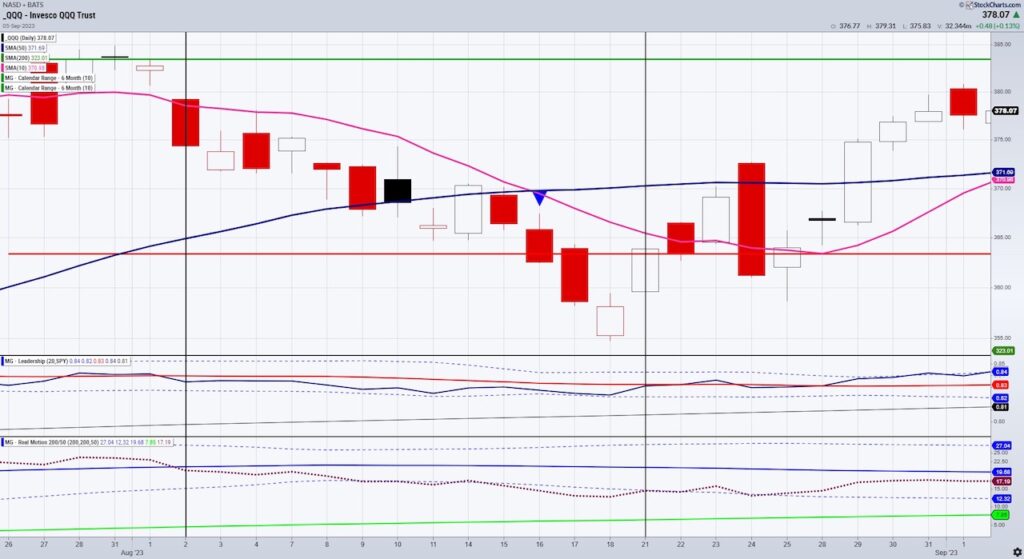
Note the second black vertical line.
On August 21st, the price cleared back over the calendar range low and Real Motion flashed a mean reversion (crossing back above the dotted Bollinger Band lines).
Plus, QQQs began to outperform the SPY once again.
Of course, nothing is perfect.
However, many of you have heard me either talk or write about these 3 indicators repeatedly because they have served as a backbone for my market timing.
Currently, QQQs are heading back towards the July 6-month calendar range low and into support.
QQQs are once again underperforming SPY.
As for momentum, that is waning with price after the FED announcement “higher for longer.”
A cautious but not necessarily a full-blown bearish approach to the market is what our plug-ins are telling us.
You can find these indicators at our site MarketGauge.com or on Stockcharts.com.
Twitter: @marketminute
The author may have a position in mentioned securities at the time of publication. Any opinions expressed herein are solely those of the author and do not represent the views or opinions of any other person or entity.


