Friday morning, Benzinga interviewed me for their morning prep show (link at end of blog). If you listen in, you will get an update on the economic modern family and the charts. I also discussed the Chinese tariffs.
As one who follows the agricultural and soft commodities NYSEARCA: GSG carefully, a couple of thoughts emerged from the recent activity.
Interestingly, an article by Tyler Durden from zerohedge.com, came out simultaneously.
We do not know one another, nor did I see the article before I spoke to Benzinga.
Perhaps the contemplative nature of the pond in Vancouver’s Chinese garden helped spark the forthcoming thoughts.
Nonetheless, Durden and I drew similar conclusions.

Furthermore, Bloomberg did a story about how China “Ratchets Up Stimulus, Cutting Reserve Ration to Lowest Level Since 2007.”
This move by China injects liquidity into their economy, partly to stave off the trade-war headwinds.
How then, will you know for real that China is serious about negotiating tariff terms with the U.S?
Trump also addressed the tariffs and impact it has on the low agricultural prices by stating, “I gave the farmers US$16 billion, which makes them totally whole on China. That’s what China spends on a good year.”
Yet, has it helped the prices of corn, wheat, and soybeans?
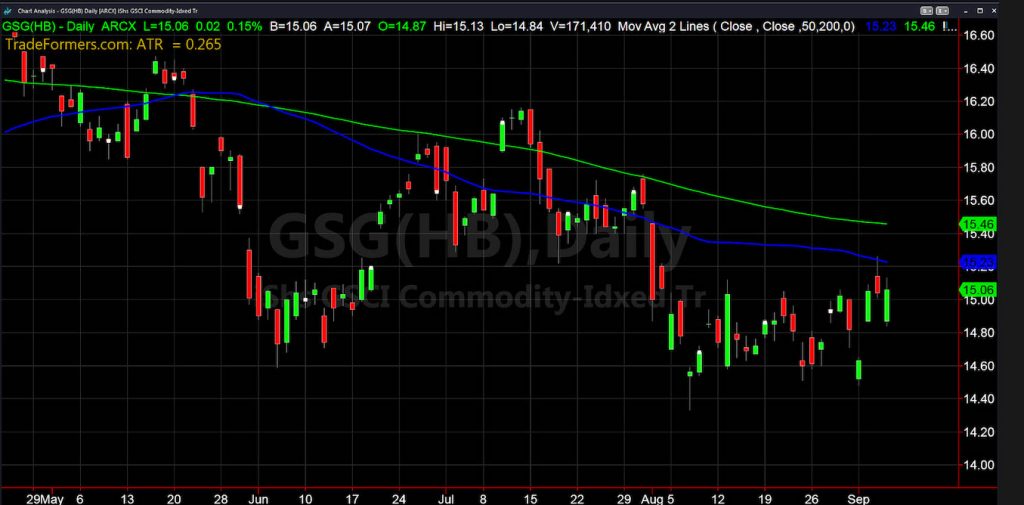
In Durden’s article, he mentions GSG or the ETF that Goldman Sachs uses to track the commodity index.
Although heavily weighted in Treasury bills and US dollars, it also holds crude oil, natural gas, copper, wheat, corn, live cattle, gold, soybeans and lean hogs in its basket.
In the past, I have shown you the Agricultural Commodities only ETF NYSEARCA: DBA and more recently USCI or the ETF that tracks the US Commodity Index.
Both remain weak with DBA making a new all-time low and USCI, which tried to clear its 50-DMA, winding up failing it by the end of the week.
China has stopped buying the US crops. If you want to hit a big part of Trump’s base, punishing farmers is a direct hit for certain.
Therefore it stands to reason, that if you really want to know what’s happening between China and the US, look no further than GSG, DBA, USCI-or any of the ETFs that track the agriculturals.
The chart of GSG shows us the same weakness, although not as bad given the other components like oil and gold in its basket, as does the chart of DBA.
With the price below both the 50 and 200 daily moving averages, even with the recent metal strength along with the treasury yields, GSG is still in a bearish phase.
Personally, I’d watch DBA-or the purest of the 3 ETFs mentioned that holds ags.
Not only could you be privvy to a low risk buy when and if China and US make a deal, but you will also have the most reliable way to discern the fake from the real news concerning China’s willingness to negotiate.
Here’s my Benzinga interview 09/05 (it starts at 33 minutes and 14 seconds)
I was busy this week..
Here’s my Ticker Tocker interview from September 4th.
S&P 500 (SPY) Inside day.298.83 to 296.64 is the range to follow. 294 bottom-line support. 300 will be the resistance with ATH 302.23
Russell 2000 (IWM) Inside day. But under the moving averages. 148.00 is rock bottom support. 150 closer support. Now, it needs to close over the 50-DMA at 150.78 and ideally close over the 200 DMA and 50-WMA at 152.15.
Dow (DIA) 265.75 is the 50-DMA which is now the number to hold. 270 area resistance to clear.
Nasdaq (QQQ) Inside day. 189 the 50-DMA cleared making that the key support. It must continue to lead with all time high 195.55
KRE (Regional Banks) Inside day.49.50 pivotal support. On the weekly charts, it needs a close over 52.10 then 53.15 to get interesting.
SMH (Semiconductors) Inside day.We do love our sister semiconductors. 118.00 area is the support to hold so the gap remains. Resistance 121.43 then ATH 123.56
IYT (Transportation) 185.60 or the 50DMA is the area to hold. 184.35 the 200 DMA next. 189 next resistance.
IBB (Biotechnology) The 200 WMA at 102.67 did not clear.
XRT (Retail) Could not hold over 41.14 or the 50 DMA so back into an unconfirmed bearish phase. 40 support.
Twitter: @marketminute
The author may have a position in the mentioned securities at the time of publication. Any opinions expressed herein are solely those of the author, and do not in any way represent the views or opinions of any other person or entity.


