With the entire Family holding recent gains and potentially consolidating, we wait for one sector to show us the way.
I am continuing with the plan to keep Tuesday and Thursday’s Daily brief.
With more thorough commentary on Monday, Wednesday and Friday, Tuesday and Thursday I will stick to a quick synopsis of what I consider to be the main highlight(s).
Then, go directly to the ETF levels.
Today’s main highlight is Granny Retail XRT.
2 weeks ago we talked about the weekly chart and how if XRT got to 44.00 and could not clear, it could spell the top for equities.
Thus far, XRT is proving us right. However, the week is only at a midpoint.
Keep your eyes on XRT between 42-44. The way that range break is a good indicator for what’s coming next.
Commodities excluded from that analysis.
S&P 500 (SPY) Some support at 298, but under that can see 295 quickly. And only a move above the new ATH negates the topping pattern.
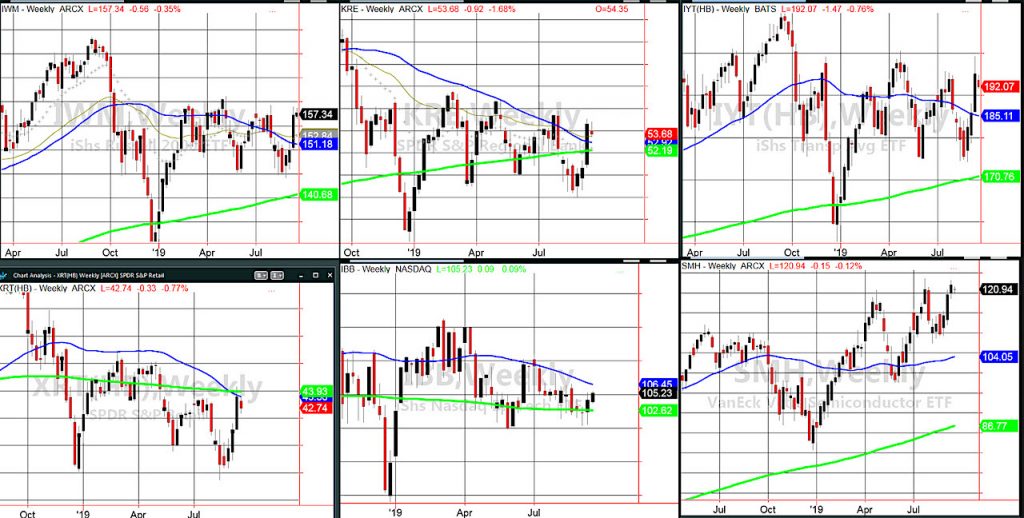
Russell 2000 (IWM) 154.50 now the closest pivotal support. 160 resistance.
Dow Jones Industrials (DIA) ATH 273.99 made in July. 270 is price support.
Nasdaq (QQQ) 191 support to hold or we see 189.50 fast. 195.55 ATH.
KRE (Regional Banks) 53-55 the range now to watch.
SMH (Semiconductors) 120 support and ATH 123.56
IYT (Transportation) 190.00 pivotal support and 200 overhead price resistance.
IBB (Biotechnology) 105 or the 50-DMA cleared for a confirmed recuperation phase.
XRT (Retail) 44.00-we will see if this spells the top of the move or not. So far, yes.Get more of Michele’s market insights and analysis over at Market Gauge.
Twitter: @marketminute
The author may have a position in the mentioned securities at the time of publication. Any opinions expressed herein are solely those of the author, and do not in any way represent the views or opinions of any other person or entity.
: All Energy Hands on Deck!")


: All Energy Hands on Deck!")