Tomorrow is a half day for the U.S. stock market, followed by a day off on Thursday for the July 4th holiday.
Friday should be equally as slow as it was today for investors…
Henceforth, today appeared trendless.
While NASDAQ 100 (NASDAQ: QQQ), the Dow Jones Industrials (NYSEARCA: DIA) and the S&P 500 (NYSEARCA: SPY) all held onto gains with inside days, the Russell 2000 (NYSEARCA: IWM) fell by nearly .6%.
While the dollar and yields both sank, gold, cryptocurrencies, gold miners and silver rallied.
Utilities saw buyers.
Grains and soft commodities dipped, but corn futures rallied.
The economic Modern Family closed mixed.
None of the aforementioned changed phases however, except for one key sector-Regional Banks KRE.
Note that corn did go back into a bullish phase unconfirmed.
KRE deteriorated in phase from bullish to bearish.
Although Transportation IYT held onto the 50-DMA by a hair, on the weekly chart, IYT failed the 50-WMA.
Therefore, what the heck IS the trend?
Let’s channel an 80’s sitcom…
Should we be like the Tanner’s, who take in Alf, a sarcastic, friendly alien life form that crash-lands on earth?
Or will we wind up like their cat Lucky, who did not wind up so lucky?
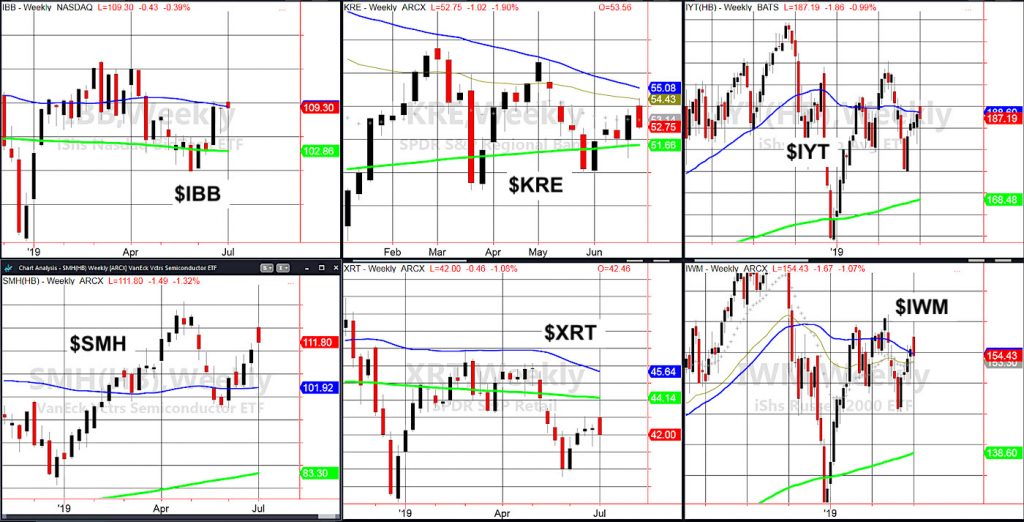
The weekly charts show us exactly what to watch before we decide to house an alien.
Top left, Biotechnology IBB, is not a bad place to watch. Sitting right on the 50-WMA (Blue), if it holds, we will most likely see a move to 114-115.
If it fails, the weaker speculative longs, will have to bail.
Top middle is Regional Banks KRE. With lower highs, should KRE fail to close the week out over the green or 200-WMA, that is not a great sign.
Top right is Transportation IYT. This is a no-brainer. Either IYT gets back over the 50-WMA (blue) by the end of the week, or it takes another trip down to 180.
Bottom left is Semiconductors SMH. As in most of the rallies since 2018, this has led. However, without her kin, those rallies have been short-lived.
Should SMH break below 110 along with weakness in the other parts of the Family, it could crash land back down to around 102.
Middle bottom is Retail XRT. IF XRT is forming any kind of bottom, then it must first get out of a bearish phase on the daily chart, or clear 42.85.
Finally, the Russell 2000 IWM, is also sitting right on its 50-WMA.
In each episode of that late 80’s sitcom, ALF has to learn how to adapt to life on earth.
Seems like in each day in the market, we investors have to learn how to adapt to where the money is going.
S&P 500 (SPY) – 296.92 printed a new all-time high although it closed at below the June 20thhigh. Inside day. Support at 293.40
Russell 2000 (IWM) – 154.70 is the major pivotal 5-WMA to watch. 161 resistance overhead.
Dow Jones Industrials (DIA) – Inside day. 269.28 all-time high with 265 support.
Nasdaq (QQQ) – Inside day. 191.32 all-time high. 187 support.
KRE (Regional Banks) – Unconfirmed bearish phase with 53.30 first pivotal resistance and 52.45 support.
SMH (Semiconductors) – 115.70-116 resistance. Support at 110 then 108.80
IYT (Transportation) – 190 first level to clear again. Support at 185.80.
IBB (Biotechnology) – 109.45 the pivotal number to watch this week.
XRT (Retail) – 42.45 pivotal area-has to get back above 43.15. Support at 41.75
Twitter: @marketminute
The author may have a position in the mentioned securities at the time of publication. Any opinions expressed herein are solely those of the author, and do not in any way represent the views or opinions of any other person or entity.
: Creating Bullish Divergence?")

 and Semiconductors (SMH): Concerning Price Pattern?")
 and Semiconductors (SMH): Concerning Price Pattern?")


