An interesting article based on cycles and commodities versus stocks suggests that over the past 90 years, stocks have outperformed commodities by 4 to 1.
Within those 90 years though, there are times that commodities outperform stocks, generally for about 15 years.
The author believes that we will see such a cycle begin July 1, 2023, and conclude June 30, 2038.
Now this is cycle work with no fundamental reasons cited.
Nonetheless, it caught my attention as those of us who still believe commodities are in for a second wave higher are dwindling in population.
Which of course also has my attention by the mere fact that investors have short memories on the value of raw materials in short supply that are further impacted by weather, geopolitics, social unrest, and rising demand.
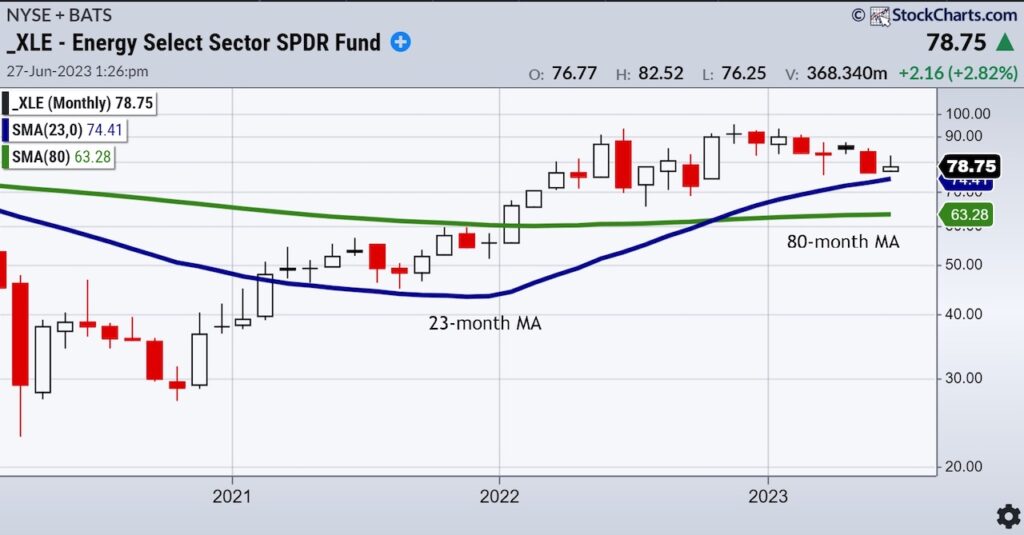
Furthermore, just look at a monthly chart and think expansion as measured by the 23-month moving average or roughly 2-year business cycle.
The SPY is above the 23-month MA, as is Transportation (last night’s daily), technology and NASDAQ.
The Russell 2000, Retail, Banking and Biotech sectors though, are nowhere near that MA-in fact, maybe more hinting at further contraction.
The energy ETF XLE is a good example of an area of commodities that went into expansion in 2021 and since has consolidated.
In this consolidation and correction, XLE holds the 23-month MA.
The chart of the dollar against the Euro is also of interest if one believes currencies have anything to do with a potential commodity bull cycle.
This is a daily chart that shows the dollar is breaking down.
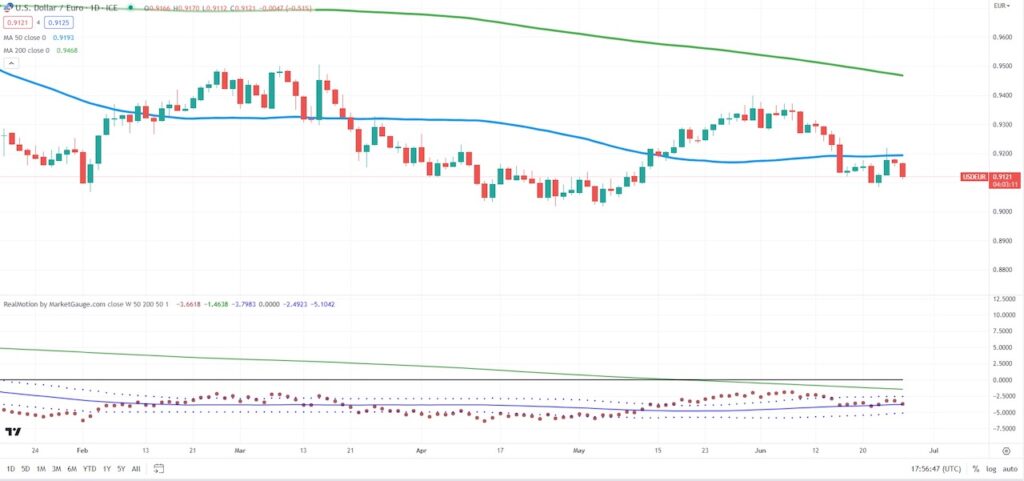
The currency pair illustrates the dollar is vulnerable to the Euro with its position in a bearish phase.
Price is trading under both the 50 and 200-DMAs and, the stack in also in a bearish phase.
Real Motion or the momentum is in better shape as the red dots sit on the 50-DMA keeping the phase just slightly above bearish.
Should the U.S. Dollar/Euro break down under .90, that could confirm the start of a much bigger commodities cycle.
However, at this point, XLE has to hold above 75.00.
And the dollar could just as easily hold support against the Euro and rally above .92.
One thing for certain, this 15-year cycle will reveal itself very soon.
Twitter: @marketminute
The author may have a position in mentioned securities at the time of publication. Any opinions expressed herein are solely those of the author and do not represent the views or opinions of any other person or entity.


