Wells Fargo reported earnings today, and I thought it would be interesting to share four quick charts.
Below I look at core operating metrics, along with net charge offs as a percent of loans and net charge offs on credit cards and auto loans.
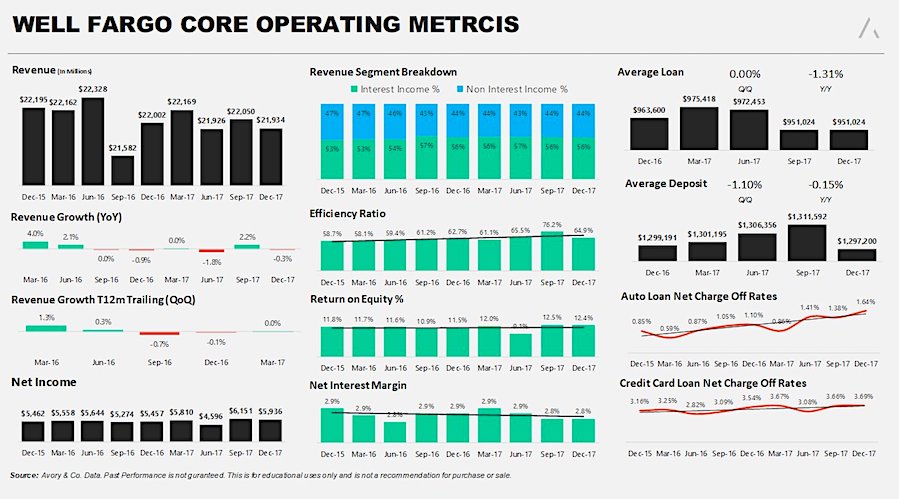
First, here’s a look at Wells Fargo’s core operating metrics:
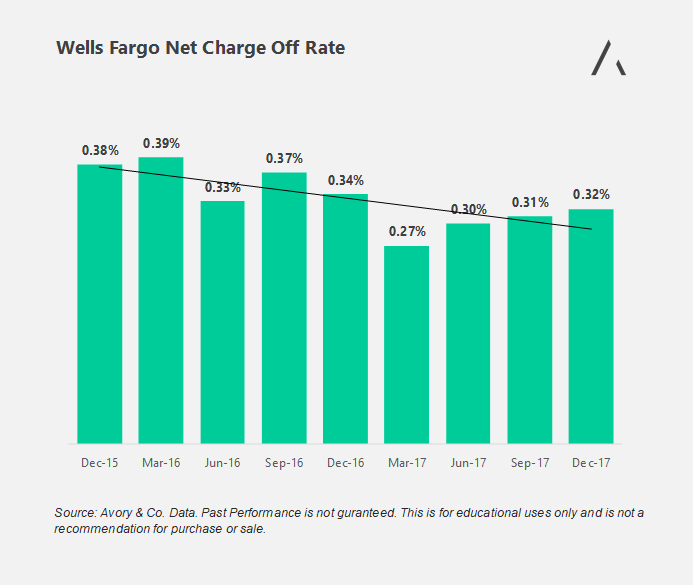
An excellent way to understand the health of the bank’s balance sheet is through their net charge-offs as a percent of total loans. While this isn’t a forward indicator, the directional trend can help inform us of potential future economic conditions.
Net charge-offs overall for Wells are low, trending lower, and muted. Currently, they just reported a net charge-off rate of .32%, up quarter on quarter, but down year on year.
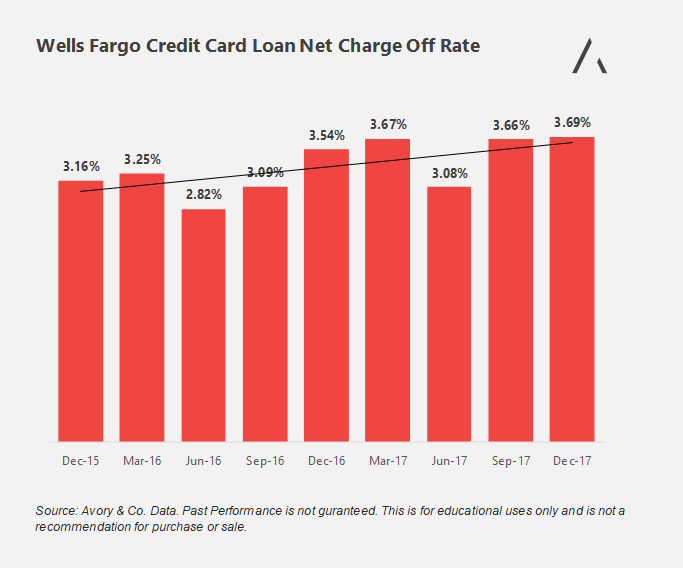
Their credit card loan business is less rosy. The trend continues to move higher, and their earnings report indicated a 3.69% rate. This level is well above 2 years ago, and .03% above the prior quarter.
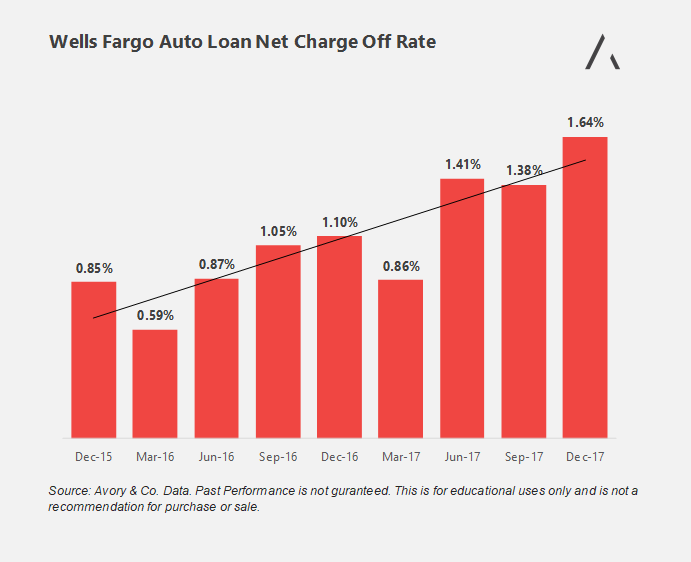
Lastly, their auto loan business. Charge-offs within autos have moved up considerably. The most recent reading was 1.64%, twice the rate seen in 2015. The trend in autos is higher, and the recent reading was well above the 2 year trend.
Autos and credit cards only make up roughly 9% of Wells overall loan book, this is why Wells isn’t seeing the broader risk to their loan book. Wells focus remains in commercial and non-commercial real estate segments, which is rather healthy at the moment. However, these internal numbers are telling us that the health of the consumer is starting to deteriorate. Wells Fargo would agree, as their auto loan book has gone from $60B in March 2017, to $49B today. Will need to listen to the conference for more color and details…
Thanks for reading.
Disclaimer from author: THIS IS NOT A RECOMMENDATION FOR PURCHASE OR SALE OF ANY SECURITIES. AVORY & CO. IS A REGISTERED INVESTMENT ADVISER. INFORMATION PRESENTED IS FOR EDUCATIONAL PURPOSES ONLY AND DOES NOT INTEND TO MAKE AN OFFER OR SOLICITATION FOR THE SALE OR PURCHASE OF ANY SPECIFIC SECURITIES, INVESTMENTS, OR INVESTMENT STRATEGIES. INVESTMENTS INVOLVE RISK AND UNLESS OTHERWISE STATED, ARE NOT GUARANTEED. BE SURE TO FIRST CONSULT WITH A QUALIFIED FINANCIAL ADVISER AND/OR TAX PROFESSIONAL BEFORE IMPLEMENTING ANY STRATEGY DISCUSSED HEREIN.
Twitter: @_SeanDavid
Any opinions expressed herein are solely those of the author, and do not in any way represent the views or opinions of any other person or entity.


