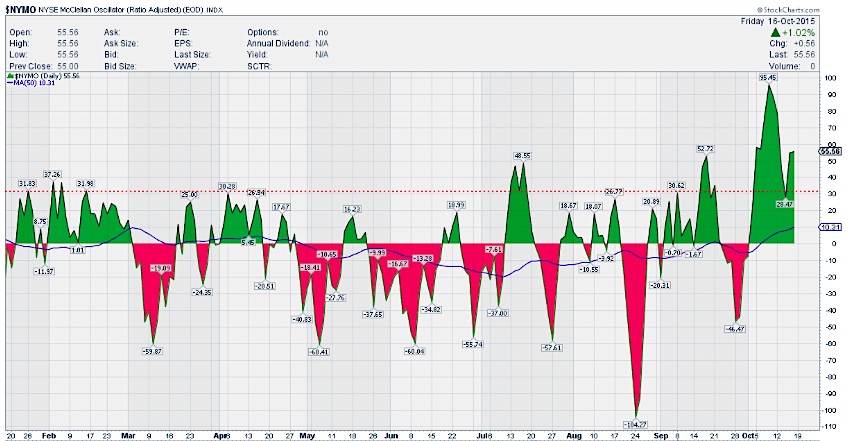
$NYMO (McClellan Oscillator): After hitting 102 a couple of weeks ago, the McClellan Oscillator worked off most of the overbought condition… but it’s nearing the overbought zone again. It finished the week at 55.56 and has room higher, if necessary, which may bode well for equities.
$TRIN & $TICK:
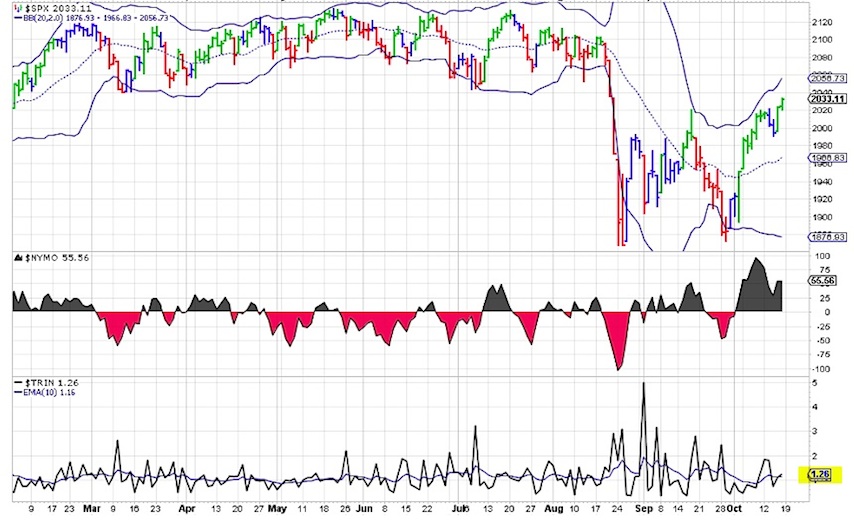
$TRIN was relatively subdued for most part of the week but started spiking a bit towards the end of the week. Overall, $TRIN has been a great gauge and since this has been subdued, there were tons of indications that the dips were being bought. Like last week, I’ll be watching this one very carefully for any spikes toward mid-week, which may indicate a pause is coming.
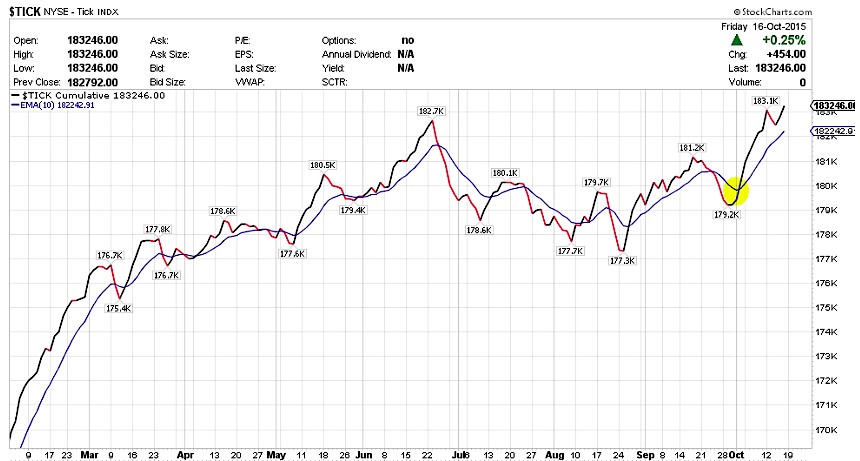
$TICK which provides a good reading of current sentiment, is continuing higher after its cross above the 10 day EMA. Tbere’s still not many negative ticks. There were a couple of days of down tick as seen in the chart but it started to rise again to end the week.
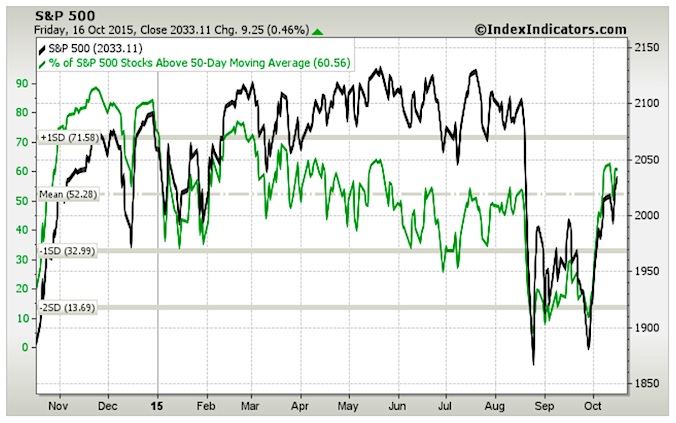
% of S&P Stocks Above 50-Day Moving Average – 60.56. Was 61.35 last week.
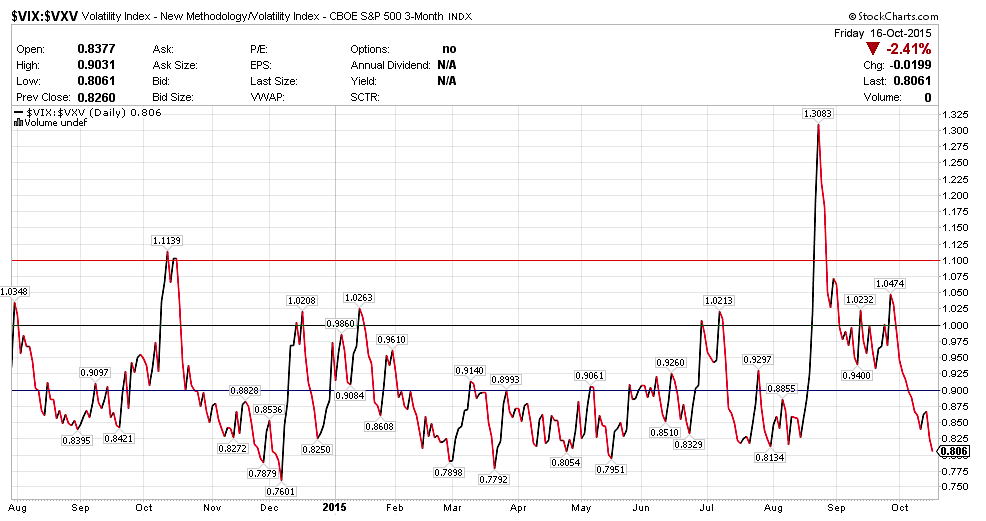
$VIX:$VXV:
$VXV is the 3 month volatility index. The relationship between $VXV and $VIX (30 day volatility) or the ratio between them if > 1.00 often spells trouble for equities. This ratio is now at 0.806 and continues to fall. If there is a slight turn next week, that might mean a pause for the equities in the shorter timeframe.
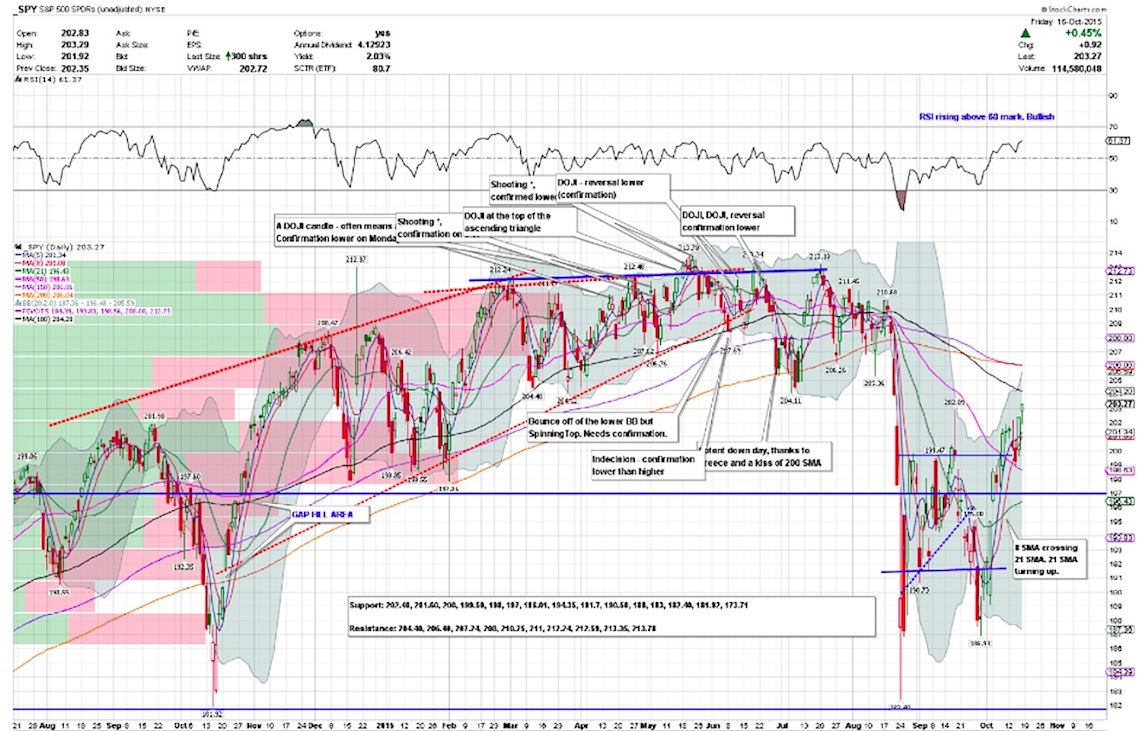
$SPY DAILY TIMEFRAME:
The S&P 500 ETF (SPY) opened the week Monday with another DOJI to add to the one from the previous Friday. A shooting star occurred on Tuesday before $SPY went lower to test the 50 day SMA on Wednesday. As I mentioned on Stocktwits and Twitter, the consolidation lead to a bull flag of sorts (above the 50 day SMA) and we saw another leg higher. The 200 day SMA is overhead and is flat along with the 150 and 100 day SMAs. A test of the 200 day SMA is not too far off. Please note that price does not need to stall there but it’s probably prudent to trim and trail around this spot.
The momentum indicators are still very bullish. RSI is rising over 60 while MACD continues to rise as well. It is now right at median. Hoping to see that MACD holds the bullish cross and rise so far. Slow STO is overbought though but getting embedded.
One caveat here. The volume has been a concern that many have sighted. Stocks can go higher when volume is lower but for any breakout, higher volume is better than lower volume. Also, the volume on the days when stocks are up needs to be higher than the ones when stocks go lower. click chart to enlarge
Thanks for reading and have a great week. You can read more of my weekly analysis on my website. Thanks for reading.
Twitter: @sssvenky
The author has a net long position in S&P 500 related securities. Any opinions expressed herein are solely those of the author, and do not in any way represent the views or opinions of any other person or entity.

: Cup (and Maybe Handle) Watch")
 Trading Near Top Of Price Range")

