Another Options Expiration is over and a tricky week for many as most were positioned for the next leg lower. A break of 200 on the S&P 500 ETF (SPY) got many bears exited and bulls worried. But Mr. Market often does the exact opposite of what one expects. This is why we use support and resistance levels to help us navigate the price action accordingly (and define our risk).
What we received last week was a nice rally after a short consolidation. It was complete disbelief for many.
All the indices are at or right near major resistance with the 200 day simple moving average (SMA) just overhead. But that does not mean we should simply sell everything. It likely means that you should protect and trim some positions and add on strength if we get above resistance. There is a ton of FOMO (Fear of Missing Out) and chasers will chase if we break above resistance (as many retail traders are under-invested). Either way, the resistance is there, so trade prudently.
Lots of earnings will be hitting the road in the next week or two. We have the 2 biggies in Amazon ($AMZN) and Google ($GOOG) reporting earnings next week. Earnings so far have been mixed but a slew of them are coming up. Big momo names (barring $AAPL) are outperforming while small caps, mid caps along with biotech ($IWM, $MDY and $IBB) are lagging and look vulnerable. Having said that, they may be carving out short-term bottoms which would be constructive… and may play catch-up to Large Cap names if the market breaks higher.
In general, I am seeing a lot of good bases formed for many stocks and look ready to breakout sooner than later.
The economic calendar for the upcoming week is not super heavy. The main ones are Housing Starts, Existing Home Sales, Leading Indicators and PMI Manufacturing Index.
Alright, let’s see what the charts have to say. We’ll start with market breadth indicators and then look at $SPY.
MARKET BREADTH INDICATORS:
Market Breadth continues to improve and is starting to even out a lot. As mentioned last week, many of them are looking more bullish than the last 2-3 months, even if some are overbought. As mentioned last week, from a market breadth indicators standpoint, overbought on the initial thrust higher can be a very good thing for the longer term view.
The number of stocks above their 20, 50 and 200 day moving averages has improved and so has New Highs-New Lows. The 21 day moving average that I was looking at earlier has turned lower for the CBOE equity put/call ratio. This was one of the main indicators I was eyeing. And some of the indicators that were overheated last week have all reset and indicate more room higher for equities.
SECTOR PERFORMANCE: CANDLESTICK GLANCE:
Pretty much all the sectors are overbought short-term but some may have more room before needed consolidation. The most strange thing is that even the Utilities ($XLU) caught a bid higher. click chart to enlarge
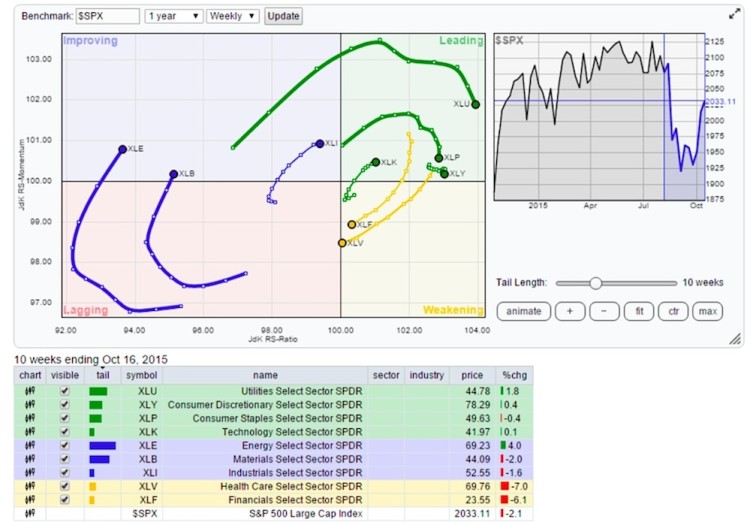
Here’s the Relative Rotation Graph (RRG) chart showing the leaders and the laggards among the 9 sectors.
BULLISH PERCENT INDICES – EOD:
A pictorial representation of the Bullish Percent Indices. There is a lot of constructive action here. Nothing bearish showing up just yet but some consolidation along the way. click chart to enlarge
$CPC – Put/Call Ratio:
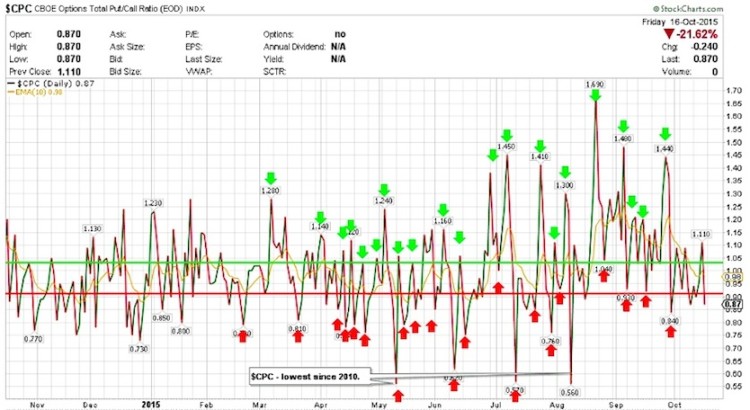
The put-call ratio $CPC is still in the range between 1.20 – 0.80. While it go either way from, this looks better for equities shorter-term to continue higher although some wear and tear is starting to appear. It is still painting a bullish picture.
continue reading on next page for more charts and analysis…


