Weekly Market Outlook & Technical Review – January 27th
In this research note, we will look at some key stock market indicators, the health of the S&P 500 Index (INDEXSP:.INX), and a handful of emerging themes that we are watching in our investing research:
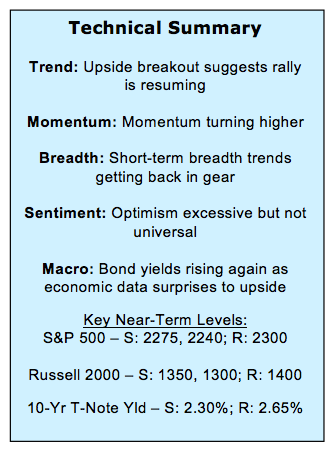
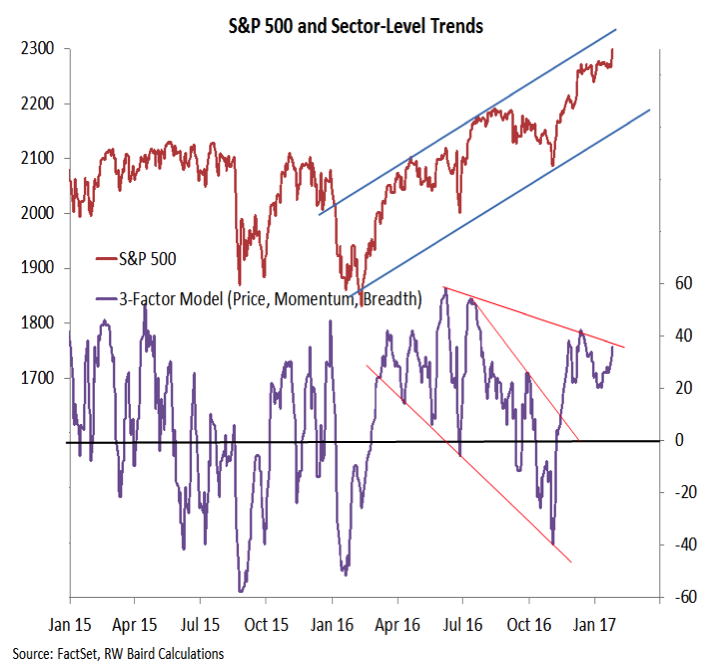
Consolidation Yielding to Breakout – After seven weeks of consolidation, stocks have broken out to the upside. While the Dow Jone Industrials (INDEXDJX:.DJI) crossing 20,000 for the first time has attracted the bulk of the headlines, the move to new highs has actually been broadly based. The number of issues making new highs is expanding and our sector-level trend indicator is testing down-trend resistance.
Individual Investors Lose Faith in Rally – Most measures of investor sentiment show still elevated optimism and complacency: bulls outnumber bears by 3-to-1 on the Investors Intelligence survey, the NAAIM exposure index is approaching 100%, and the VIX has a 10-handle. The AAII survey of individual investors, however, shows more bears than bulls.
Copper Testing Resistance – In this week’s Macro Update (With Fundamentals In Focus, Attention Turns To Earnings) we shared charts showing that upward momentum in industrial commodity prices tends to be bullish for earnings and the economy. The chart on Copper shows that its post break-out consolidation appears to have nearly run its course and the path of least resistance could soon be higher.
Stock Market Indicators
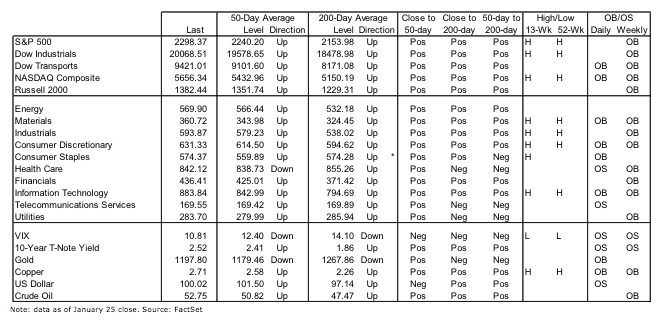
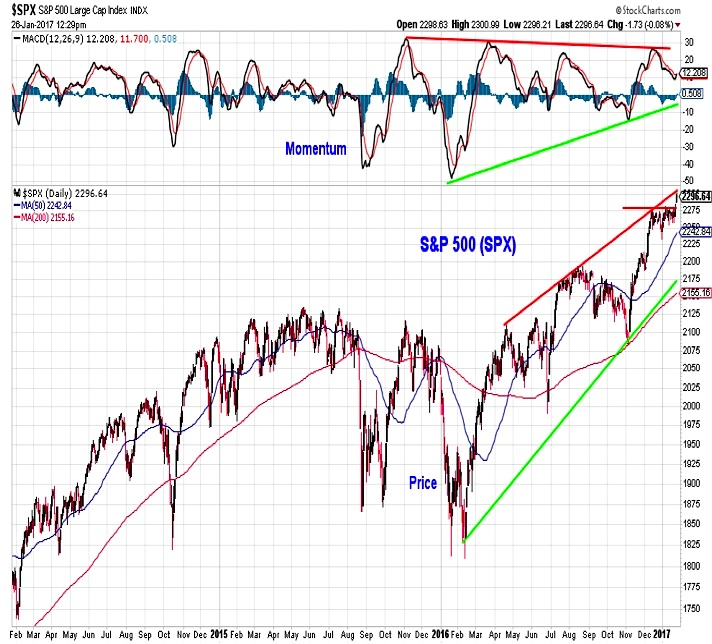
S&P 500 Index
While the Dow Industrials have gotten the bulk of the round-number attention for this week’s break above 20,000, the S&P 500 has made new highs of its own and is also approaching a round number (2300). Daily momentum has turned higher for the first time since mid-December, supporting the view that this break-out represents a re-assertion of the up-trend (and is, therefore, bullish).
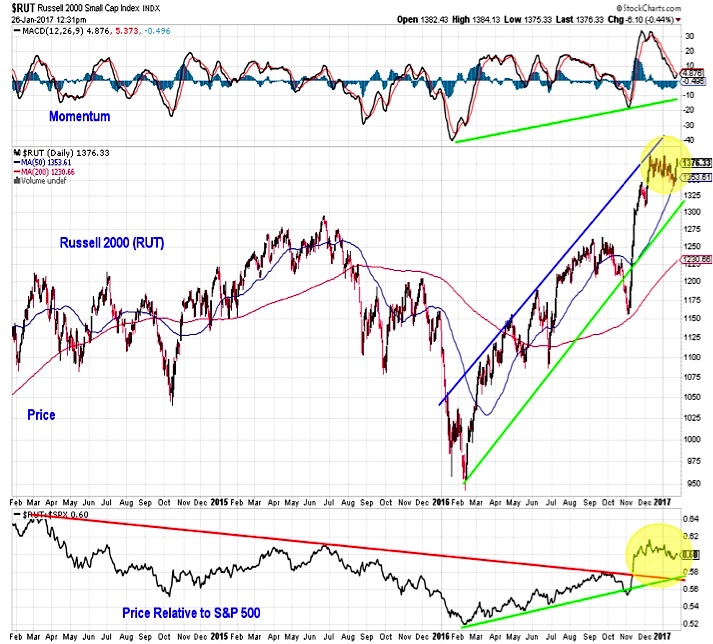
Russell 2000
The Russell 2000 (INDEXRUSSELL:RUT) has held support at its 50-day average, but it remains within the trading range established since mid-December. On both an absolute and relative basis the Russell 2000 has yet to breakout. On the positive side, daily momentum has ticked higher and the relative price line continues to be consistent with a post-breakout consolidation. The relative leadership from small-caps that emerged over the course of 2016 appears to still be intact.
Market Trends & Breadth
Beyond the up-tick in index-level momentum, evidence of strength from our sector-level trend indicator would increase our confidence in the sustainability of recent strength on the S&P 500. Right now this indicator has yet to signal the all-clear, but it is now testing down-trend resistance.
continue reading on the next page…
: Creating Bullish Divergence?")


 and Semiconductors (SMH): Concerning Price Pattern?")


