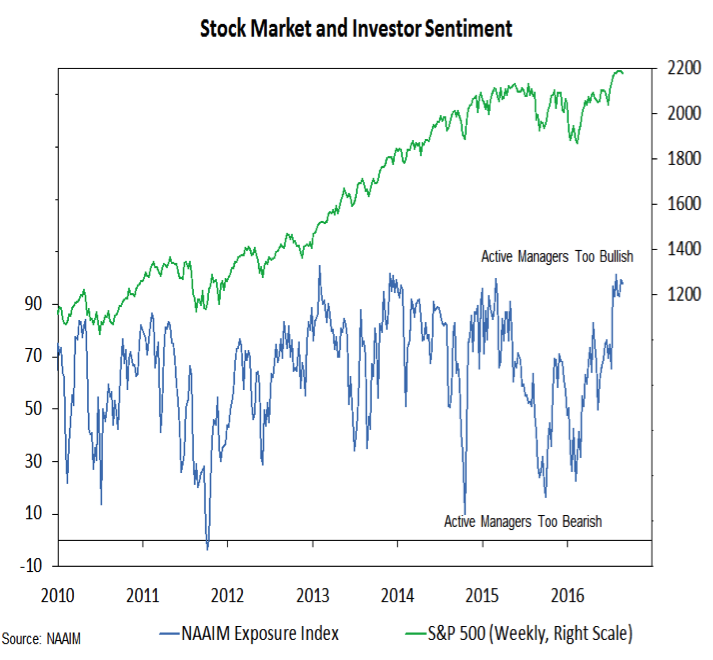
Active investment managers have also become excessively optimistic. The NAAIM exposure index dropped one point this week (from 99% to 98%) but this was the seventh consecutive week with a reading above 90%. The bearish contingent has thrown in the towel, as no firms report having net short exposure to equities.
The message from the sentiment data overall is that the skepticism that was present at the end of the second quarter has been replaced by optimism, and that could make the road ahead for stocks a bit bumpier.
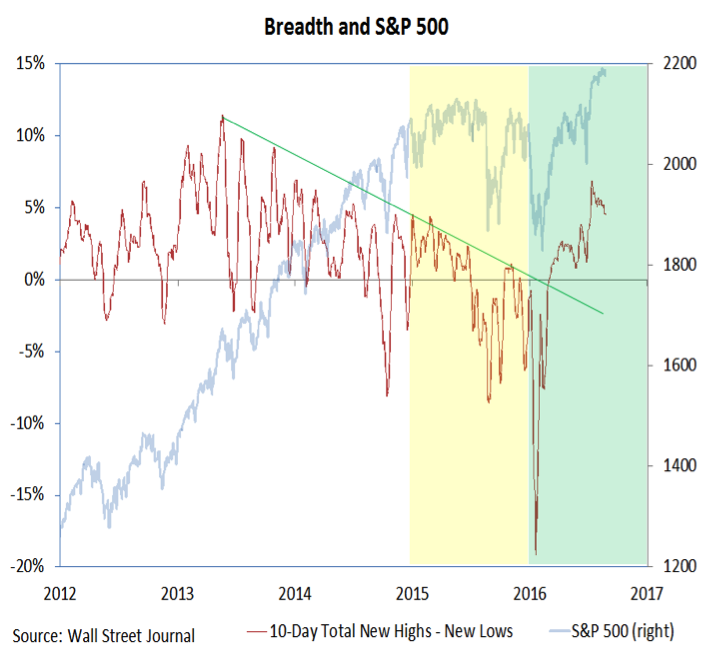
Stock Market Breadth & Trends
While longer-term breadth indicators (like the percentage of industry groups in up-trends) remain healthy, shorter-term breadth measures suggest the rally has lost a step and is missing important underlying support. New highs this week at the index level were not echoed by an expansion in the number of issues making new highs. The pattern being seen in this indicator of net new highs (new highs less new lows) remains constructive over the longer term and echoes the strength seen in our industry group trend indicator. However, on a shorter-term basis, the narrowing in the new high list could signal the need for further consolidation/correction from the S&P 500.
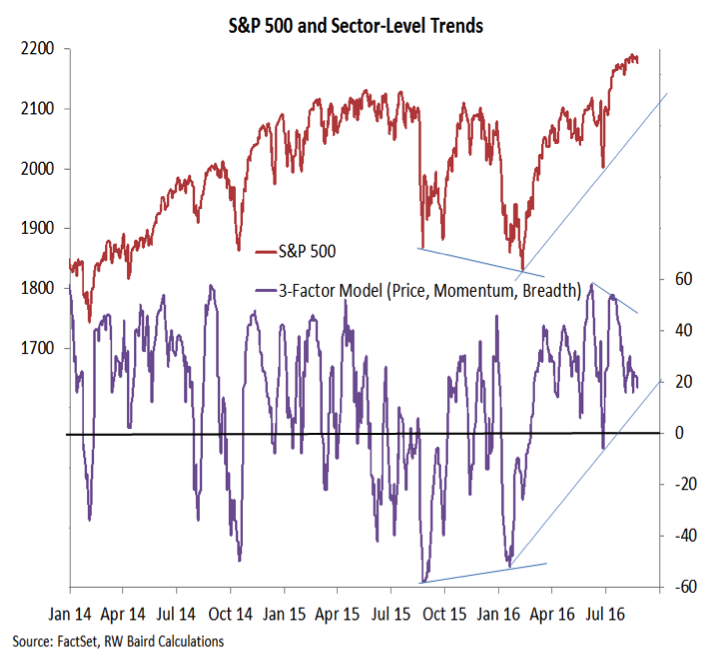
Similarly, while sector-level trends in price, breadth and momentum have stopped falling, they have not made a sustained turn higher. Renewed weakness here would increase the likelihood that we will see a pullback in the S&P 500 (which would be consistent with the historical seasonal patterns). A sustained turn higher in this sector-level trend indicator could help clear the way for a sustained move above 2200 on the S&P 500.
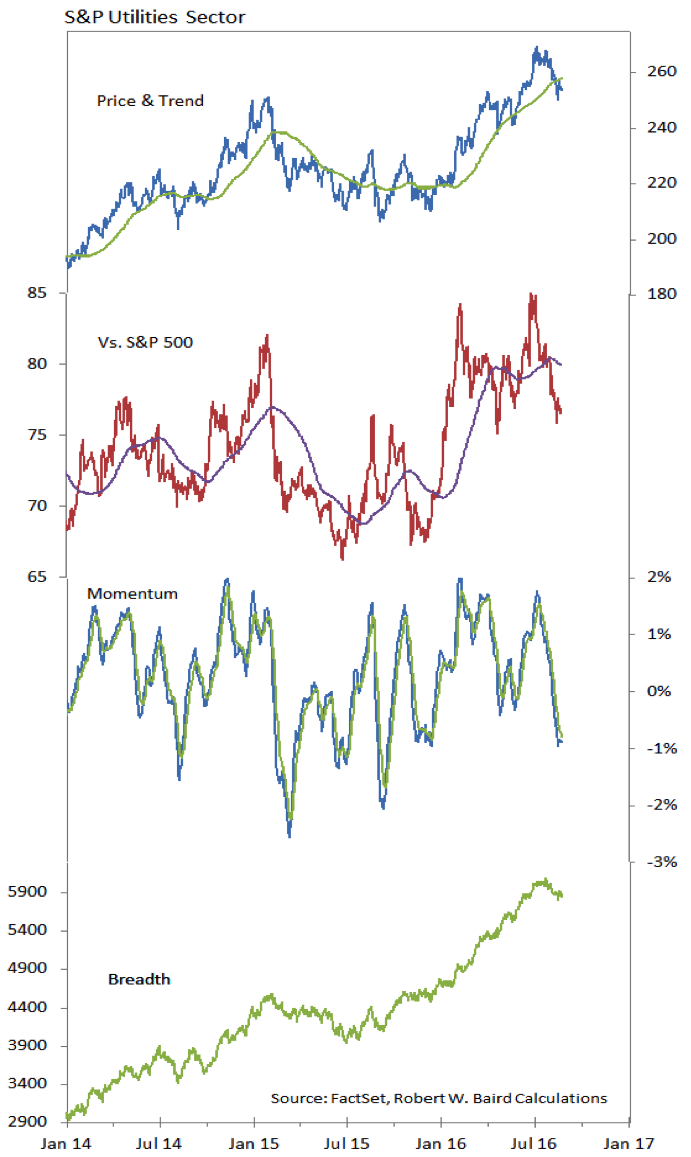
Utilities Sector Performance
The Utilities sector has weakened significantly in recent weeks. In terms of our relative strength rankings, Utilities have dropped from the number two spot at the end of July to dead last this week. Rising trend lines across the price and momentum indicators shown here have failed to provide support. Breadth, too, has started to roll over.
Thanks for reading.
Twitter: @WillieDelwiche
Any opinions expressed herein are solely those of the author, and do not in any way represent the views or opinions of any other person or entity.

: Showing Some Signs of Emerging Strength")

