S&P 500 – Equity Flows & Sentiment
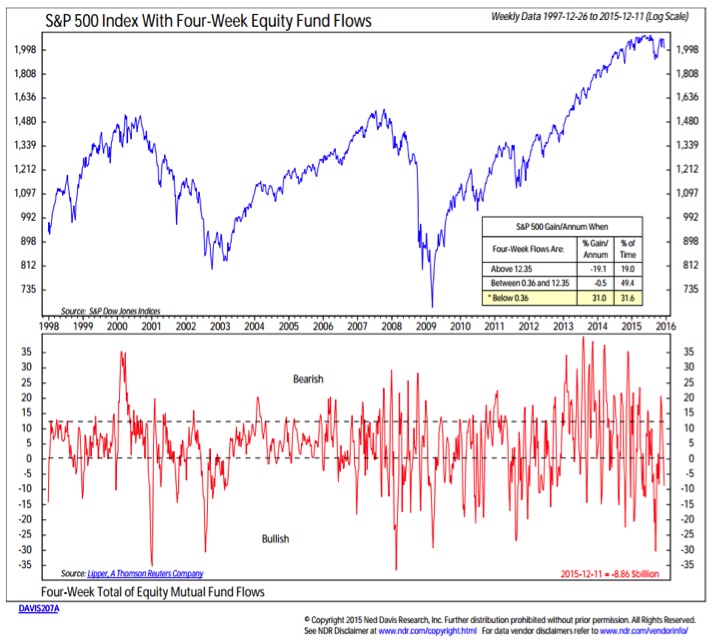
While the S&P 500 remains within a historically tight trading range for the year, and December’s performance has not deviated significantly from the historical norm, investors have nevertheless turned uncharacteristically cautious in their sentiment for this time of year.
Bulls on the AAII survey have averaged 42% in December since 1988. This week, the sentiment survey saw bulls drop to 24%, their lowest reading since 1991. Active investment managers have reduced their equity exposure and equity mutual funds have seen outflows. This rise in skepticism could be the fuel needed to help stocks fuel a santa rally into January.
Market Breadth
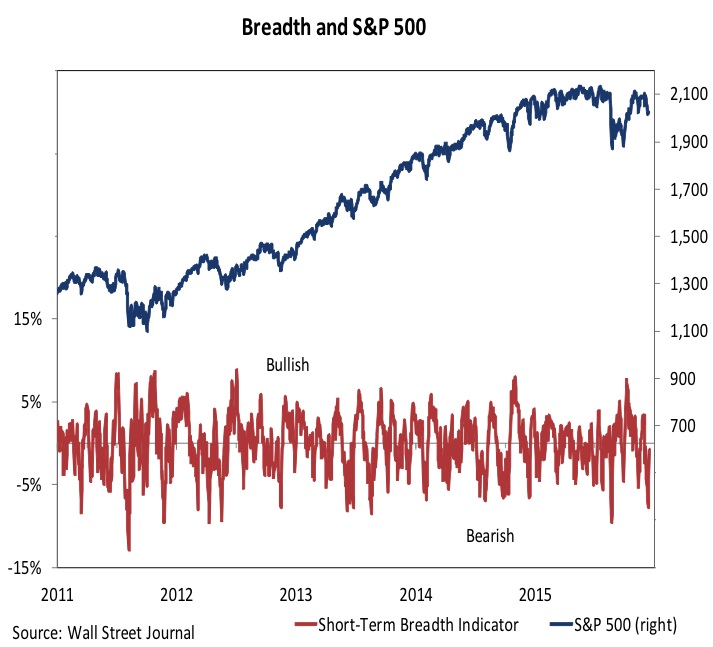
We continue to watch market breadth closely. On a short-term basis, breadth momentum has gotten as bad as it typically gets, and is bouncing from that oversold condition. The key will be to sustain that bounce and build on it. That has been a difficult feat for market breadth over the past two months.
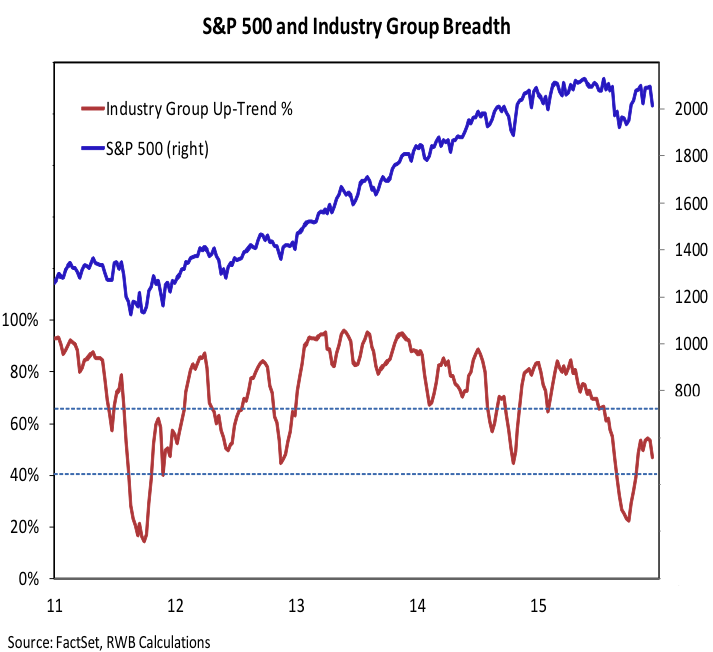
The percentage of industry groups in uptrends has some catching up to do if any year-end rally that we see is going to be sustainable as we move into 2016. After an initial encouraging move off of the bottom, breadth has lagged, failing to confirm the strength seen in the cap-weighted indexes. An expansion in this indicator above 65% would confirm broad market strength. A break below 40% would cast doubt on the sustainability of any sort of rally in the S&P 500 and could prompt a more cautious outlook in the first half of 2016.
Information Technology Sector
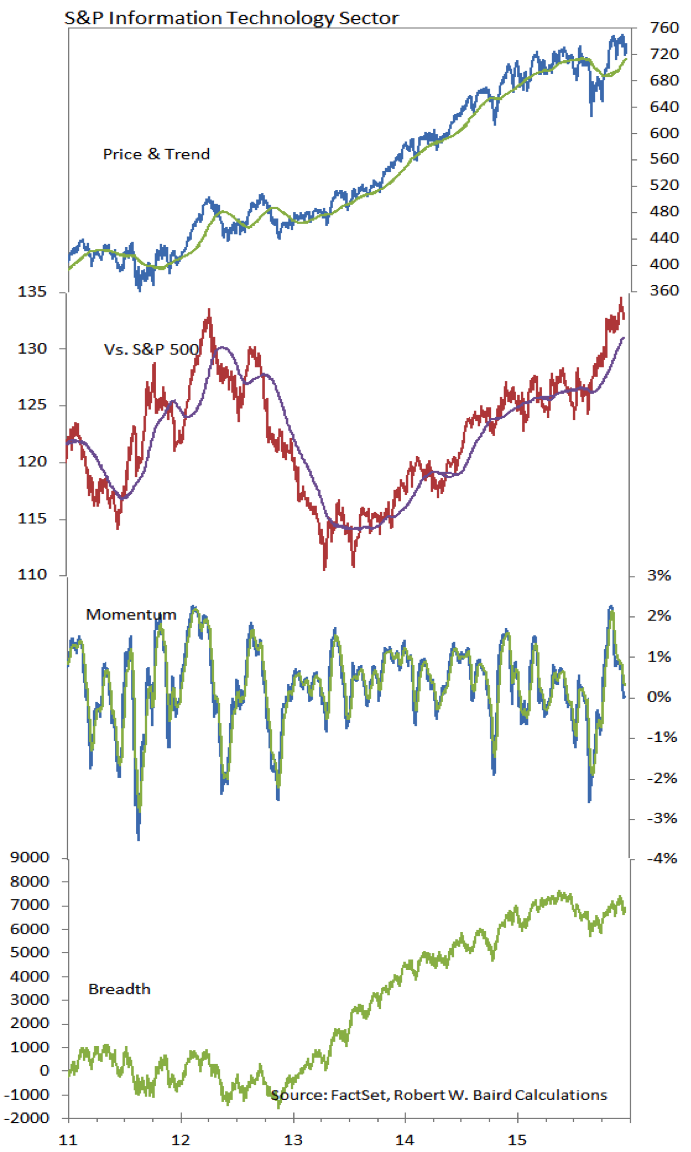
The Technology sector remains a relative strength leader, with a more vigorous relative price up-trend emerging over the second half of 2015. Overall momentum has stalled somewhat recently, and breadth remains shy of its early-year high. On an encouraging note, sub-industry trends show more areas of the sector are moving to the top of the sub-industry realtive strength rankings and we are also seeing an expansion in improving conditions at the sub-industry level.
Thanks for reading.
Twitter: @WillieDelwiche
Any opinions expressed herein are solely those of the author, and do not in any way represent the views or opinions of any other person or entity.


: Showing Some Signs of Emerging Strength")
