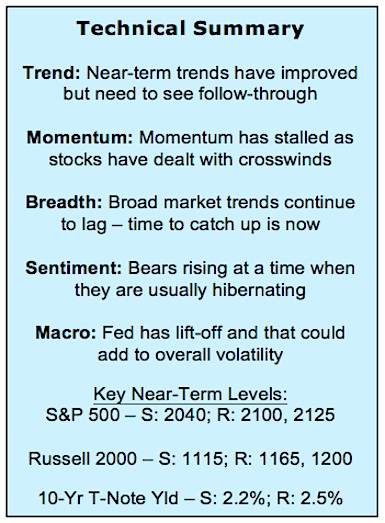
What We Are Watching:
This Week’s Stock Market Outlook:
If A Santa Rally Is On The Way, Small-Caps Could See Him First – The historical pattern is for stocks to be flat to down over the first half of December and then rally over the second half (i.e. a santa rally). This year is well situated to stay true to that pattern. If history holds, it could be small-caps that guide the way higher. So far, however, that has not been the case.
Spooked Investors Worried About The Grinch – Investor optimism usually runs high in December but this year the mood is more sour. The perception of higher volatility in 2015 has turned investors more cautious and resulted in mutual fund outflows.
It Takes All The Reindeer Pulling Or The Sleigh Might Sink – On a short-term basis, momentum in the broad market has bounced off an extremely low level and gives hope to a santa rally. The key, however, remains follow-through. It is hard to point to outright divergences, but clearly market breadth has lagged the popular averages in the fourth-quarter rally. A failure for breadth to substantially improve from current levels could weigh on stocks early next year.
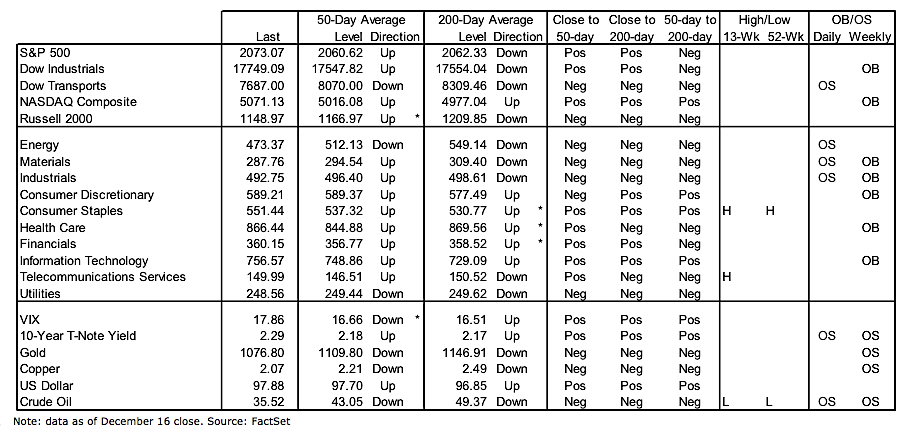
Stock Market Indicators – Indices & Sectors (click to enlarge)
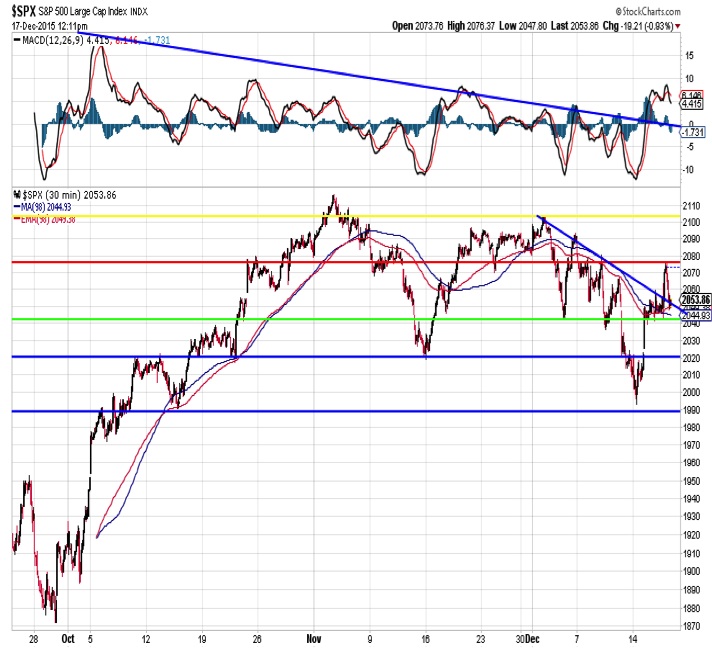
S&P 500 Index
The last two months on the S&P 500 have been a microcosm of the entire year – the index has not really gone anywhere, but it has done so quickly. While many investors came into December looking for stocks to only work higher, history shows (as pointed out by @RyanDetrick) that stocks struggle in the first half of the month, with the expected santa rally not emerging until the second half of the month. Based on what we have seen in the current example, the expected pattern could be holding true to form.
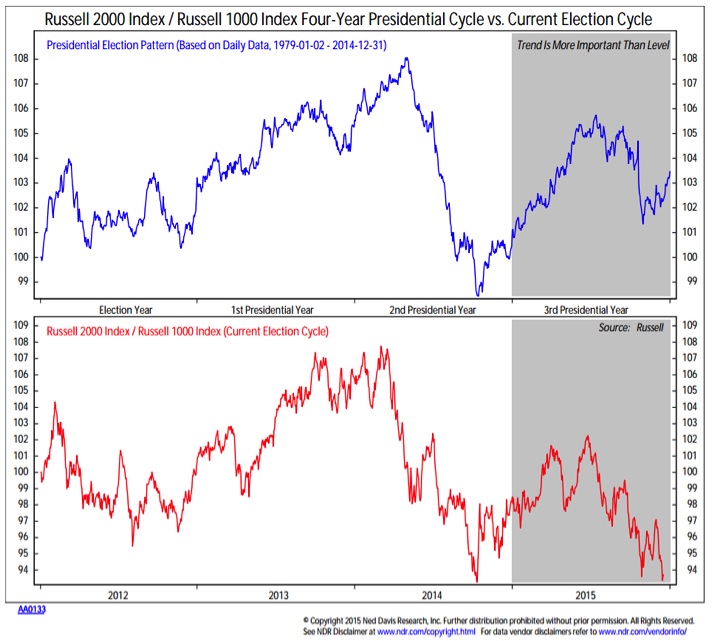
Russell 2000 – Small Caps In Line For A Santa Rally?
While the overall year-end rally tends to happen closer to year-end than many expect going in, small caps stocks tend to show relative outperformance earlier in the fourth quarter. This year appeared to be on-track from that perspective as well, but recent weakness in small caps stocks has pushed them back to their relative price lows. It is not too late for small caps to get back in gear and see a santa rally, but they have their work cut out for them, now and into 2016.
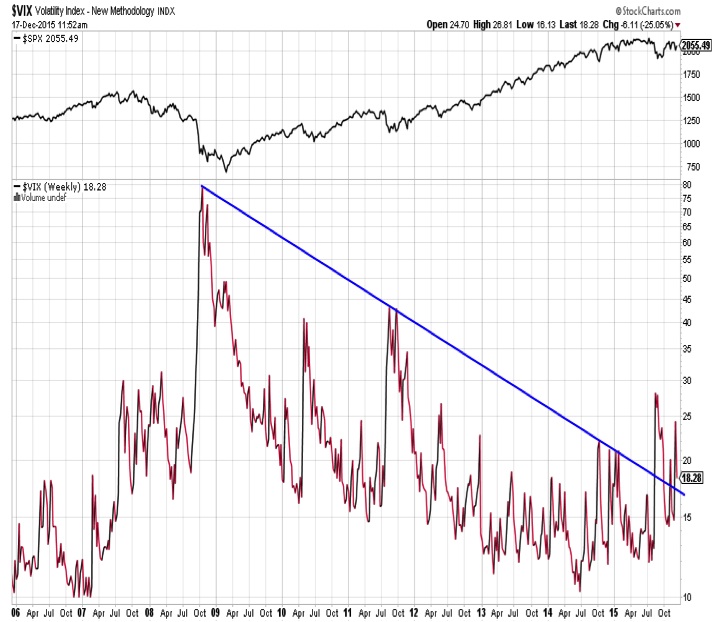
Market Volatility – A Look At The Volatility Index (VIX)
The Volatility Index (VIX) broke out of a multi-year down-trend in 2015 and that has provided the appearance and sense of an overall increase in market volatility. Data compiled by @michaelbatnick, however, would suggest otherwise. Over the past 45 years, the average spread between the year-to-date maximum gain and year-to-date maximum loss for the S&P 500 has been over 24%. In 2015, it has been closer to half that (just shy of 13%). Given various crosswinds, the perceived market volatility of 2015 could become realized volatility in 2016.
continue reading on the next page…


")


