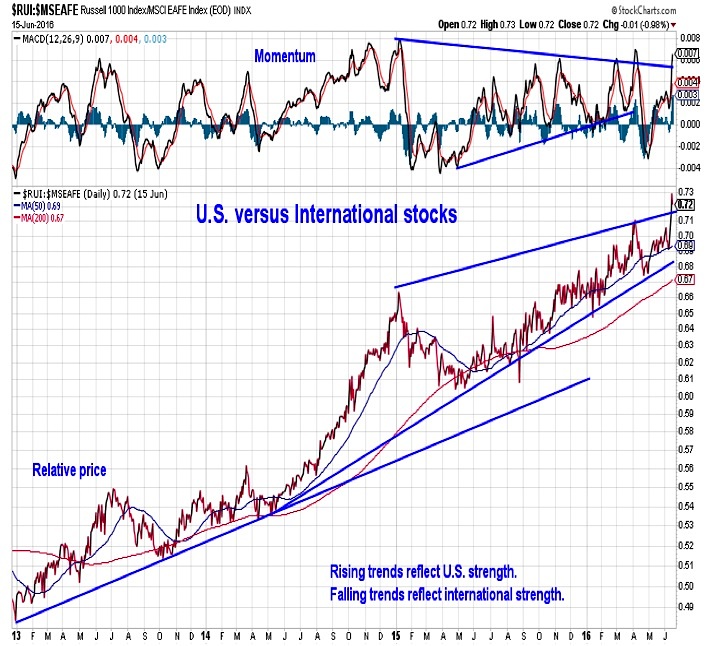
U.S. vs International Stocks
While the pullback in U.S. stocks since their early June highs might feel substantial, it has actually been quite muted relative to the weakness seen in international stocks. The ratio between U.S. and international stocks has actually surged to a new high, reflecting a strong and well-tested trend in U.S. relative leadership. The surge in relative price and breakout in momentum suggests the relative leadership trend favoring U.S. stocks may be again accelerating.
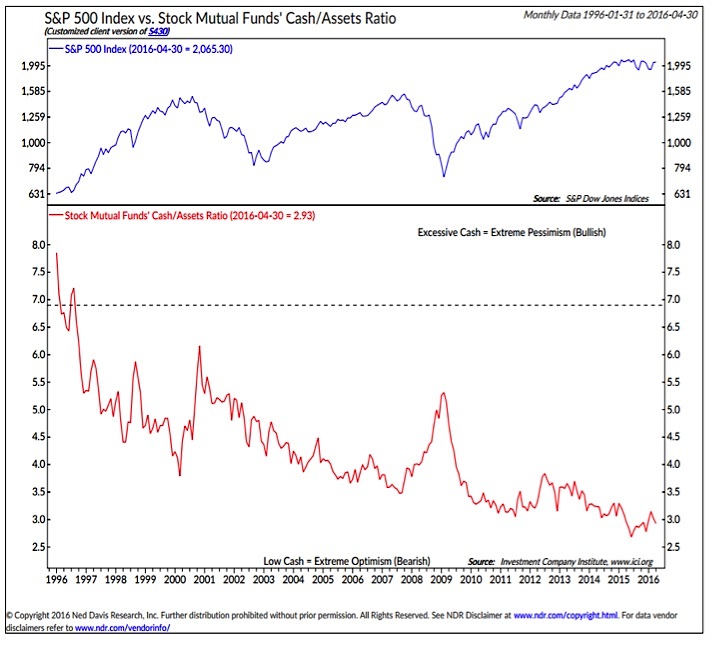
Asset Allocation
Gaining some attention this week was a survey of fund managers that indicates they have raised their cash holdings to their highest levels since 2001. This expressed sentiment stands in contrast to the data that measures actual cash levels. According to data from the ICI, mutual fund cash (as a percent of total assets) remains near record lows. Even within the longer-term down-trend, there seems to be little evidence of mutual fund managers meaningfully building their cash reserves.
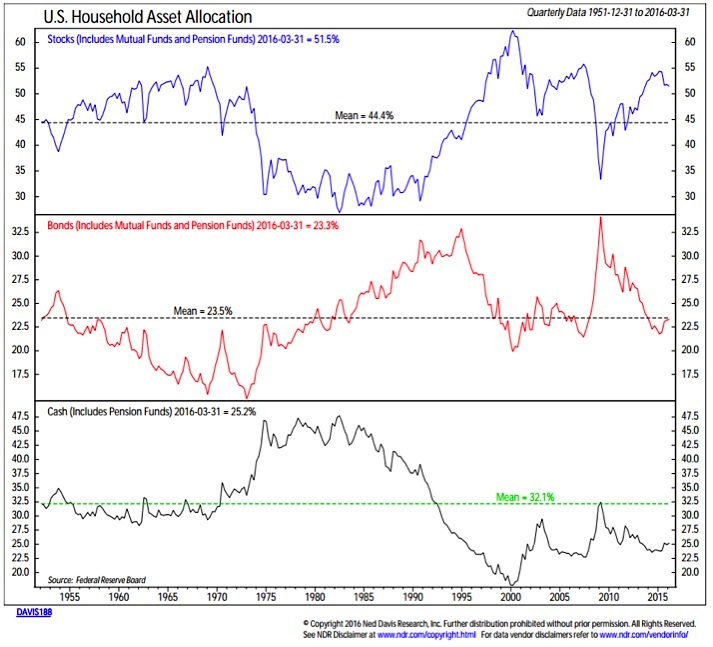
Household Allocations
With the well-reported and persistent outflow from equity mutual funds of late, it may be that cash is amassing on the sidelines at the household level. The quarterly data in the Federal Reserve’s Financial Accounts release suggests this is not the case. While the overall level of cash may be high, when considered relative to bond and equity exposure, cash holdings are still well below their long-term average. Exposure to equities, however, remains well above its long-term average.
While “cash on the sidelines” has become a popular theme in 2016 as weekly fund flow data have shown a move out of equities, it is hard to find evidence of a historically meaningful build in actual cash relative to overall assets.
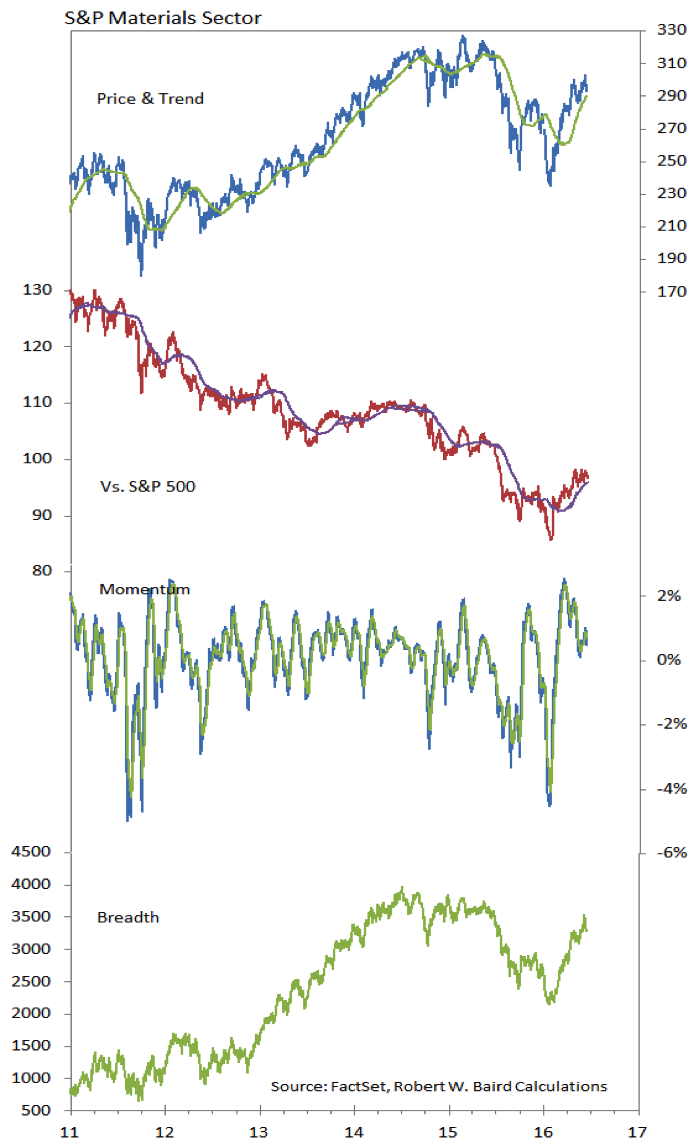
S&P Materials Sector
The materials sector is one of four sectors in the S&P 500 that are up 5% or more over the past three months (Eenrgy, Health Care and Telecom are the other three). This is more than twice the gain posted by the S&P 500 iteself. From a chart perspective, the Materials sector appears to have made meaningful price, breadth and momentum lows earlier this year. While the relative price down-trend has not yet been decisvely broken, the breadth down-trend has been.
Thanks for reading.
Twitter: @WillieDelwiche
Any opinions expressed herein are solely those of the author, and do not in any way represent the views or opinions of any other person or entity.


 May Tip Stock Market’s Next Move")
