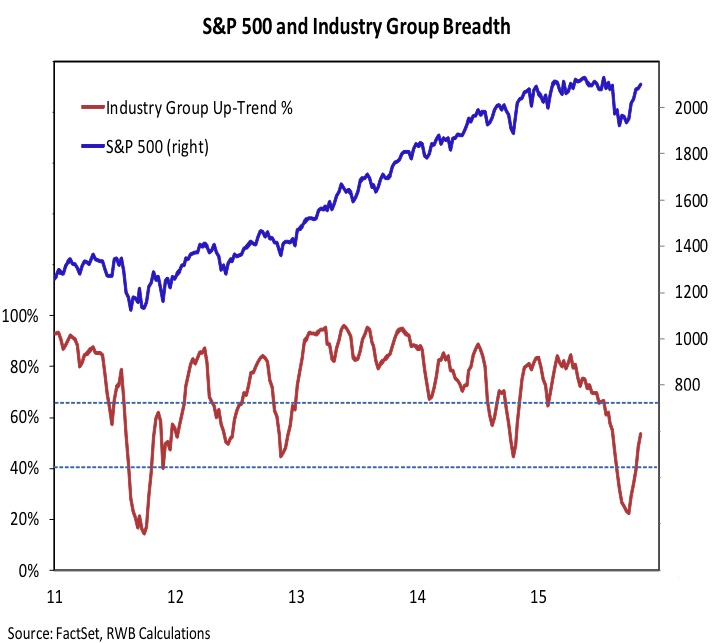
S&P 500 – Stock Market Breadth
Overall industry group trends have lagged the gains seen in the S&P 500, but it would be pre-mature to argue for a significant divergence just yet.
Consolidation in the index that allows industry group trends some time to catch up would provide a more robust foundation from which the next leg of the rally could emerge.
Note that an uninterrupted ascent in this market indicator is not necessary, but it should remain above 40%.
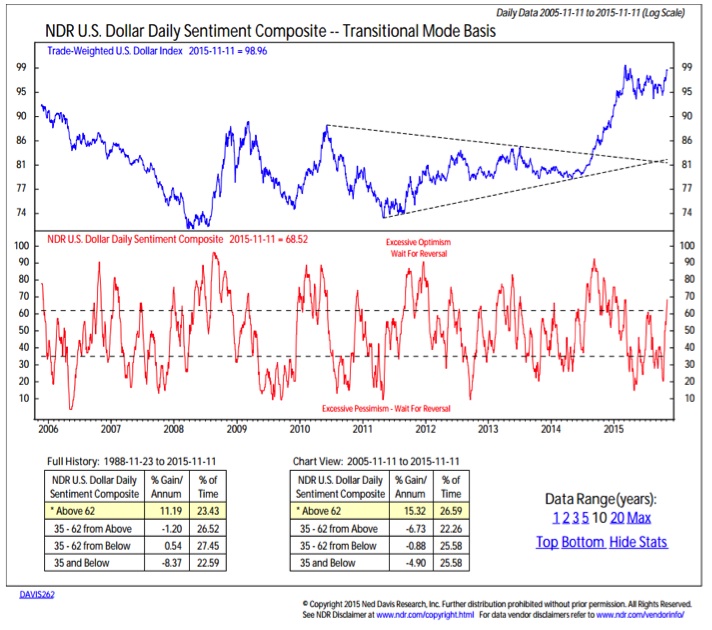
Market Sentiment
Talk of an interest rate hike in December has helped get the US Dollar back in gear. This has also led to a surge in optimism for the dollar (i.e. market sentiment became bullish). While excessive optimism is a headwind for stocks, it is a bullish development for the US Dollar. Dollar strength adds to the bullish near-term case for small caps stocks, which tend to outperform large caps when the greenback is rallying.
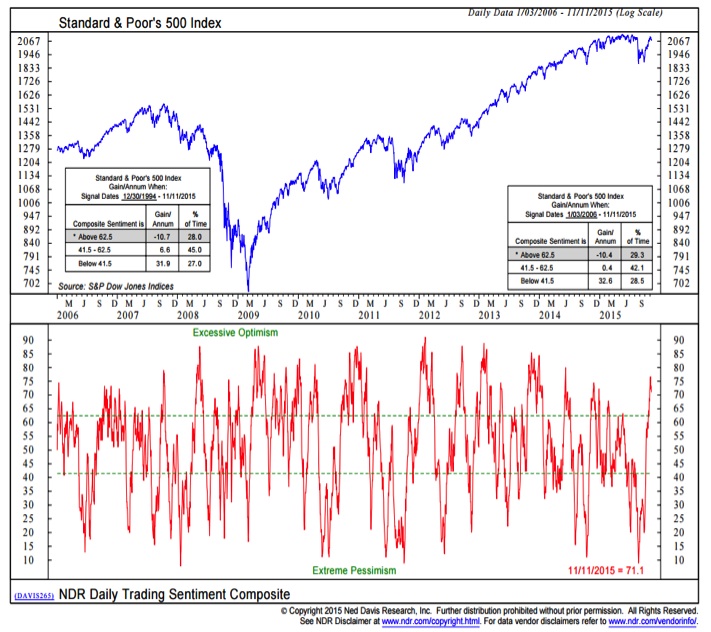
The short-term Trading Sentiment Composite was early in indicating excessive pessimism, but its impressive track record is worthy of respect. Stocks have struggled to rally when it is in the excessive optimism zone, and that is where it is now.
From a longer-term perspective, the most bullish time for stocks is when excessive pessimism has been relieved and optimism is growing. Based on the NDR Crowd Sentiment Poll, our stay in that mode was limited this time around. Optimism was initially slow to recover but has since surged.
Some near-term consolidation in stock prices could help unwind some of the optimism that has quickly ramped, and that could help clear the way for a year-end rally.
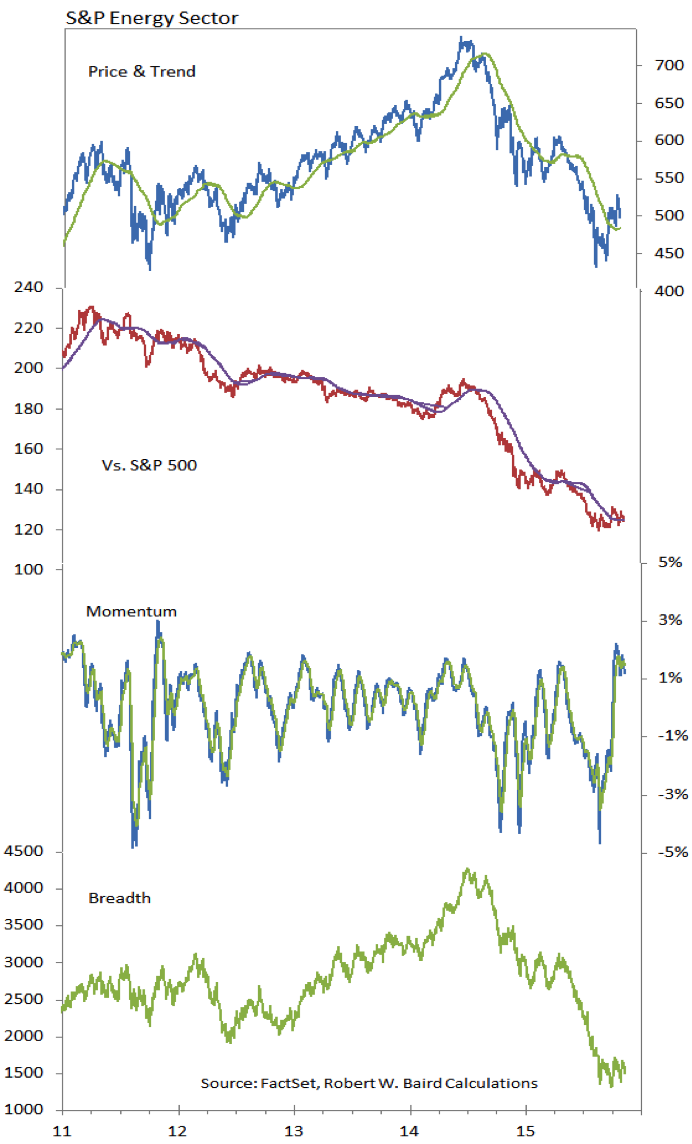
Energy Sector
The energy sector has provided good evidence of the limits of momentum that is confirmed by price or breadth. While momentum in energy surged, neither the absolute nor relative price trends reflected much improvement, and while energy market breadth stopped deteriorating, it did not show much strength. Now, momentum is rolling over and price and breadth down-trends are intact. Counter-trend rallies can be sharp, but also eventually run their course.
Thanks for reading and have a great weekend.
Twitter: @WillieDelwiche
Any opinions expressed herein are solely those of the author, and do not in any way represent the views or opinions of any other person or entity.


: Showing Some Signs of Emerging Strength")
