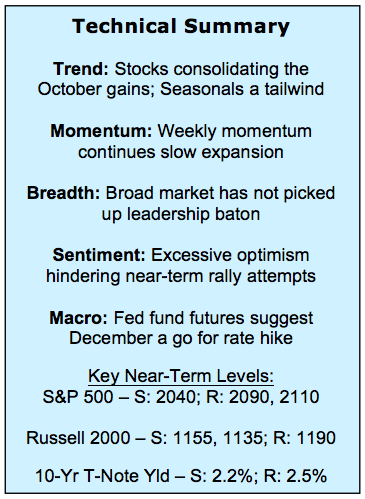
What We Are Watching
This Week’s Stock Market Outlook:
Stock Market Rally Got Ahead Of Itself – It is not so much that the 200+ point move on the S&P 500 left it technically overbought, but that the rally was accompanied by a surge in optimism but not a surge in issues making new highs or other indications of robust broad market participation. Upside momentum in stocks can carry a rally only so far.
Strength Of A Move Is Proved On The Test – As the initial momentum off of the lows has faded, the excessive optimism and lagging market breadth have come into sharper relief. If pessimism quickly re-builds and breadth indicators are able to show some resiliency, this consolidation could be limited in degree and duration. That would be the best evidence that a sustainable low is indeed in place.
Small-Caps Enjoy Seasonal Tailwind – After remaining subdued during the early stages of the October rally, optimism has become much more pronounced over the past several weeks. Composite market sentiment indicators from Ned Davis Research (the Trading Sentiment Composite and Crowd Sentiment Poll) have moved into excessive optimism zones. Some near-term price consolidation could help take the edge off.
Stock Market Indicators – Indices & Sectors (click to enlarge)
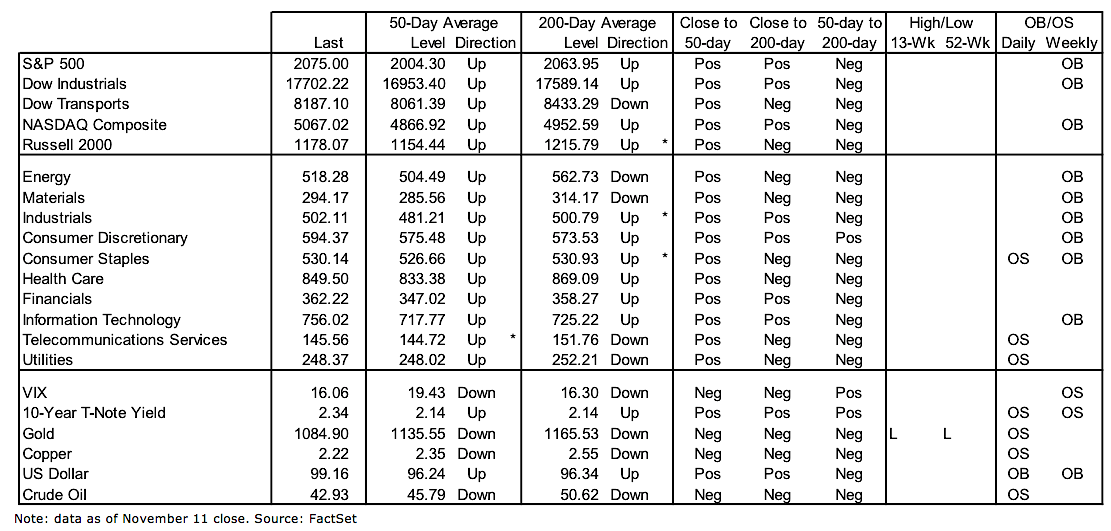
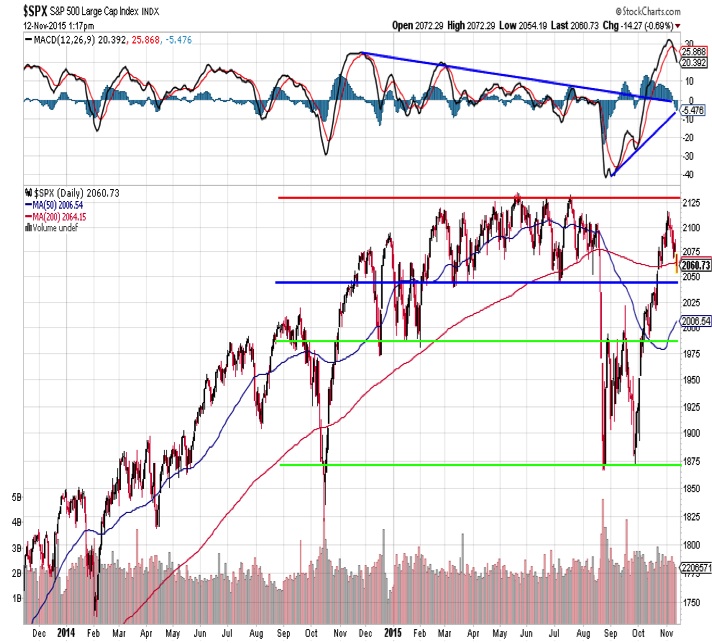
S&P 500 Index
A positive momentum divergence on the daily MACD indicator provided fuel for the October rally on the S&P 500. While the momentum downtrend was broken, the price rally has stalled as optimism soared and market breadth lagged.
The S&P 500 is consolidating the October advance, which could help momentum re-set and provide a chance for market breadth to catch up.
Russell 2000 Index
Working in favor of small caps stocks is a strong relative tailwind in a period usually marked by overall stock market strength. The small caps to large caps ratio has worked well over the course of this presidential election, particularly as it relates to year-end rally opportunities. If the pattern holds, small caps stocks could enjoy a period of leadership into the first quarter of 2016.
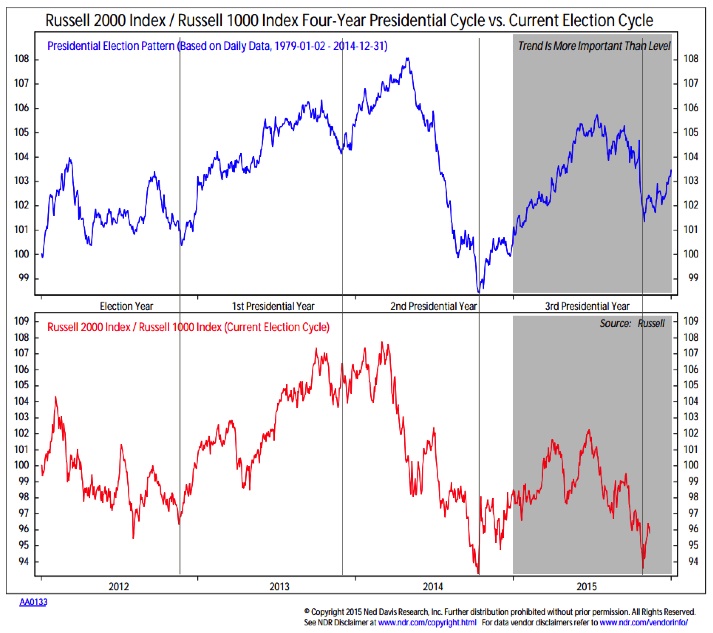
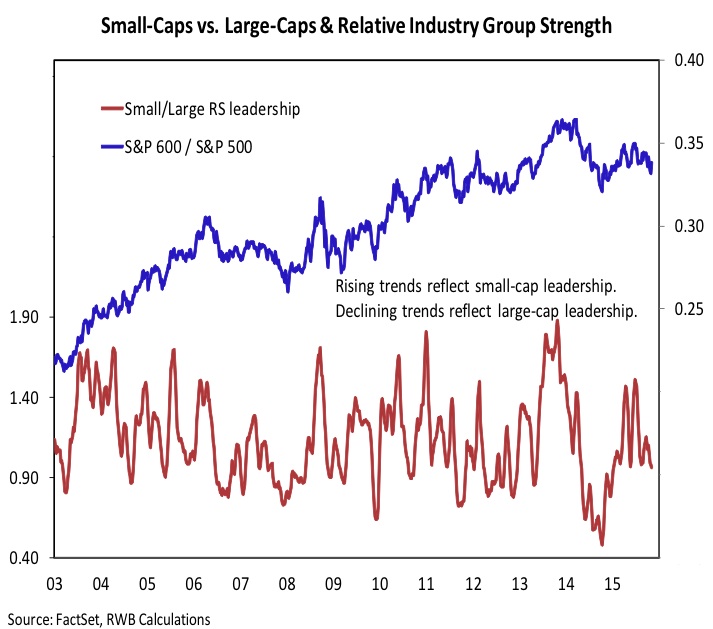
Small Caps vs Large Caps Relative Performance
While seasonal market patterns argue for small caps leadership, our industry group relative strength rankings have yet to show evidence of this emerging. A turn higher by our small/large RS leadership indicator (the lower indicator in the chart to the left) would mean small-caps groups are gaining in relative strength versus large-cap groups. That would be evidence that the expected seasonal tendency is holding true to form.
continue reading about market breadth and sentiment on the next page…


: Showing Some Signs of Emerging Strength")
