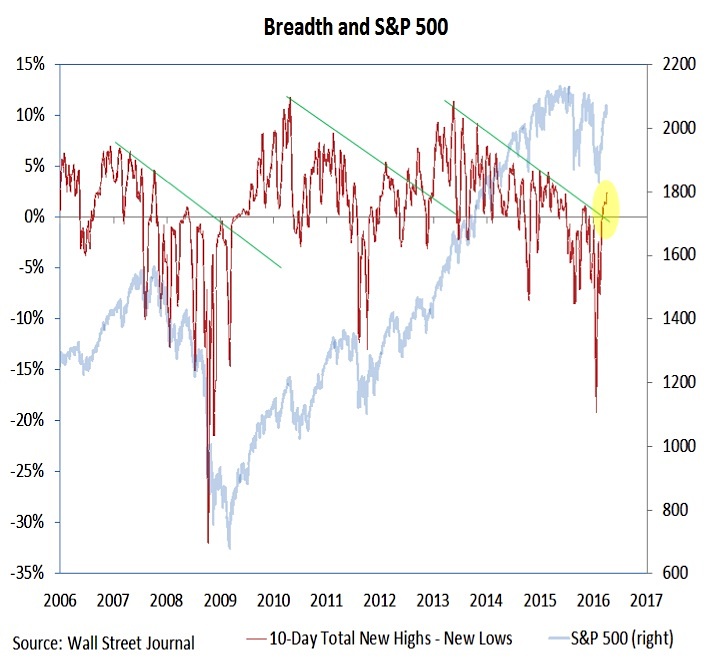
Longer term, however, the rally off of the February low has persisted long enough to see meaningful breadth improvement. The number of net new highs (new highs less new lows on NYSE + NASDAQ) has seen a significant expansion – breaking through a down-trend that has been in place for several years. While short-term breadth thrusts have helped fuel the bounce over the past seven weeks – improving longer-term breadth trends is evidence of important healing that is occurring beneath this surface. This does not preclude near-term volatility, but could be a source of support if/when downside momentum re-emerges in the popular averages.
Investor Sentiment
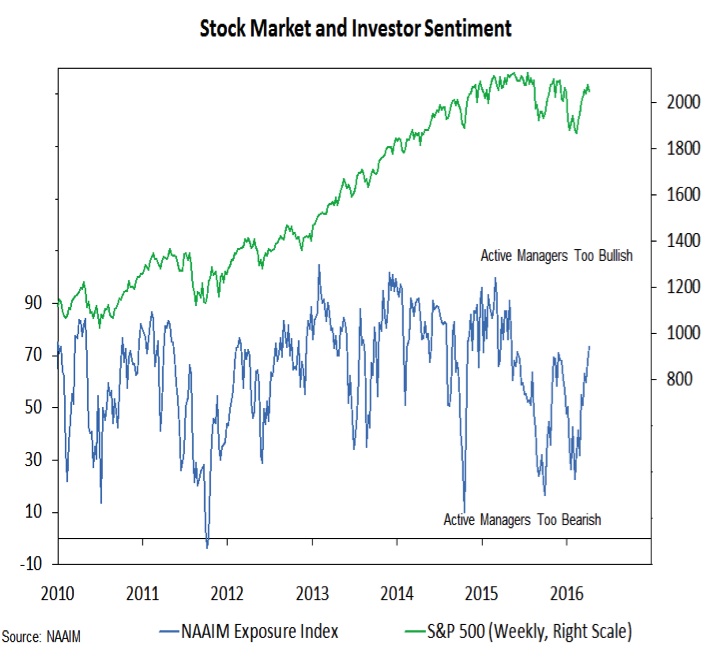
The latest update to the NAAIM Exposure Index shows average equity exposure increasing from 68% to 73%. The Exposure Index has now surpassed its November 2015 peak and is at its highest level in nearly a year. Over the history of this survey, stocks have struggled to make headway when the NAAIM Exposure Index is at 73 or above. So investor sentiment bears watching.
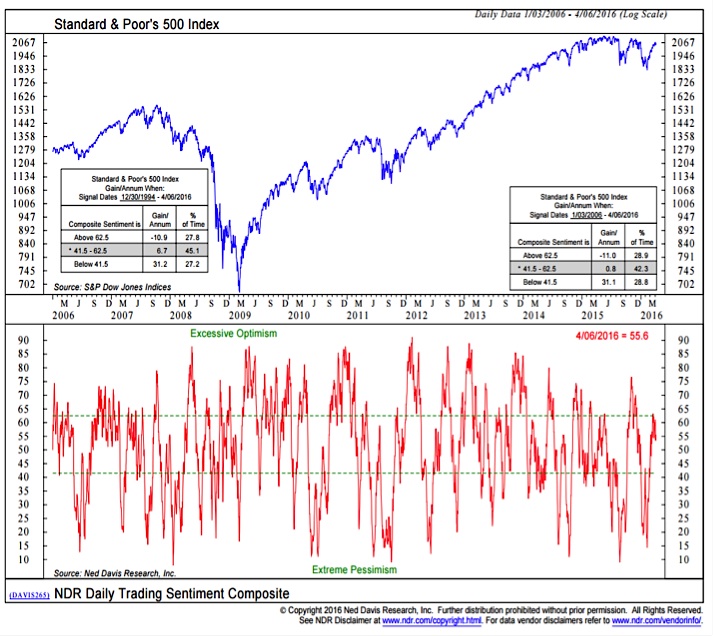
Admittedly, other sentiment surveys suggest there is still some measure of cautiousness among investors. The AAII survey, for example, shows less than one-third (32%) of respondents are bullish on stocks, although only 22% are bearish. A composite approach to the sentiment data continues to seem appropriate. The NDR Trading Sentiment Composite has moved out of the excessive pessimism zone and is now in neutral territory. While not arguing for weakness, this sentiment composite suggests that without a re-build in pessimism, stocks could struggle to add to their gains.
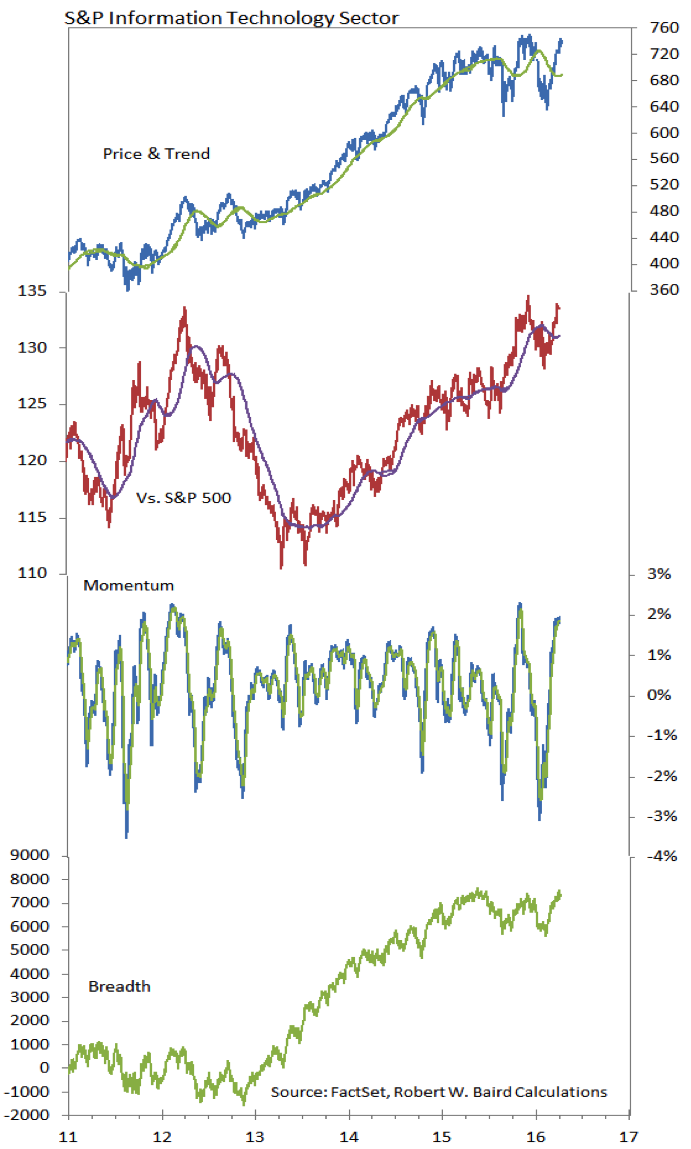
S&P Information Technology Sector
An area of resilience on the market has been the Technology sector. On both an absoltue and relative price basis, not to mention from a breadth perspective, the sector appeared to be faltering earlier this year (for most of 2016, the sector has been in the bottom half of our sector rankings). Now, however, a different picture has emerged. The relative price line held support and is rallying, while on an absolute price and breadth basis, the sector is challenging its previous highs. Last week, the sector moved into the second overall spot (behind only Industrials) in our relative strength rankings.
Thanks for reading.
Further reading from Willie: Market Insights: Household Exposure To Equities Still High
Twitter: @WillieDelwiche
Any opinions expressed herein are solely those of the author, and do not in any way represent the views or opinions of any other person or entity.


 Trading at 23-Month Moving Average")

 Continues to Flash Caution")
