Here’s a look at some key stock market indicators, charts, and themes that we are watching.
This Week’s Stock Market Outlook:
Confirmation of Strength Still Lacking – While the rally on the S&P 500 has been robust and led to an overall improvement in market breadth trends, important areas are still struggling. Small-caps have done little to change their pattern of lower highs and lower lows, while the broker/dealer index is just barely above its 50-day average. The S&P 500 itself has failed to break its pattern of lower highs, so it too still has work to do.
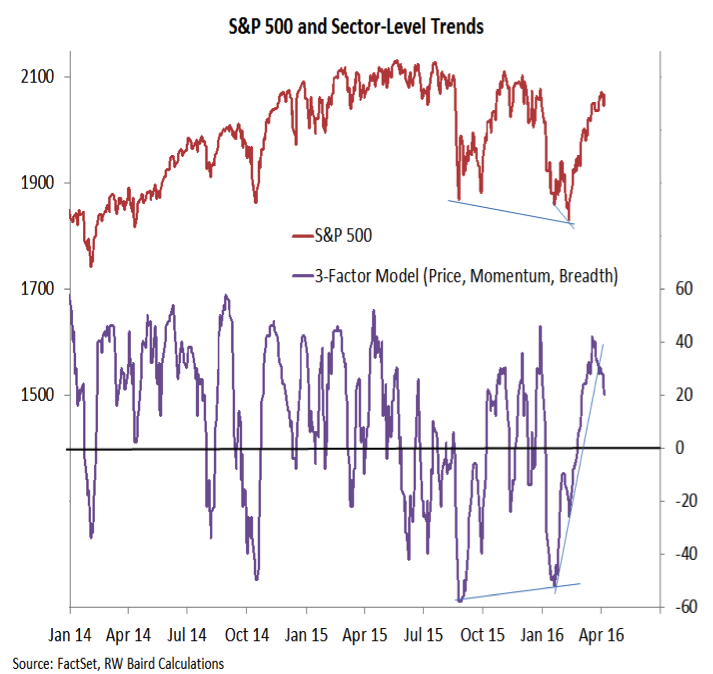
Sector Trends Cooling as Rally Hits Pause – Market breadth has improved and the expansion in the number of issues making new highs is a positive development. More recently, however, shorter-term breadth has stalled – our sector-level trend indicator, which moved ahead of the S&P 500 off of its early-year lows has now started to fall.
Evidence That Investors Are Starting to Believe in the Rally – Overall, investor sentiment appears to be neutral. The excessive pessimism from earlier this year has been relieved, but excessive optimism has not emerged. The latest data from the NAAIM refutes the notion, however, that the rally remains unloved – active money managers have their highest equity exposure in nearly a year.
Stock Market Indicators – Indices & Sectors (click to enlarge)
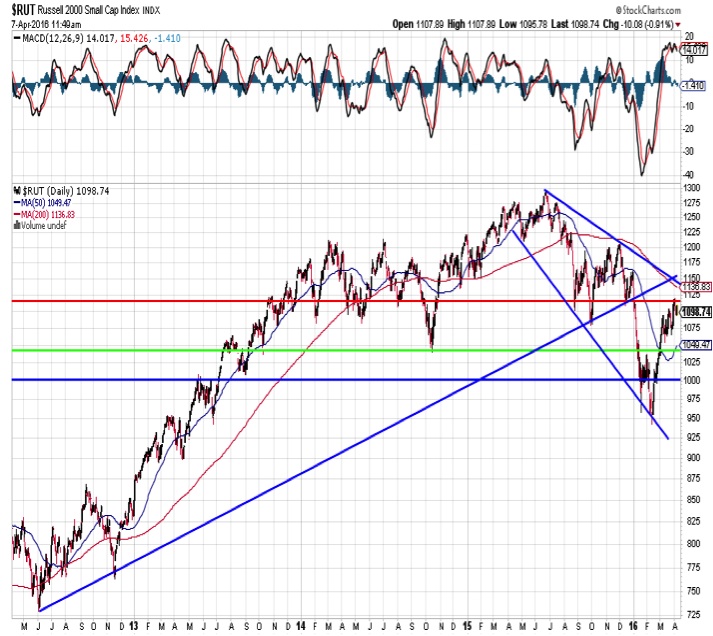
Russell 2000 Index
The rallies in the S&P 500 and the Dow Industrials have garnered attention as they have carried these stock market indexes above their 200-day averages and then into positive territory for 2016. Not all areas have seen a similar recovery. While the Russell 2000 has bounced off of its February low, it has managed neither a cross above its 200-day nor getting positive for the year. Rather, the rally so far appears to be a counter-trend move that is stalling with the down-trend still very much intact. A move above 1150 could assuage some of those concerns, but that has yet to be seen.
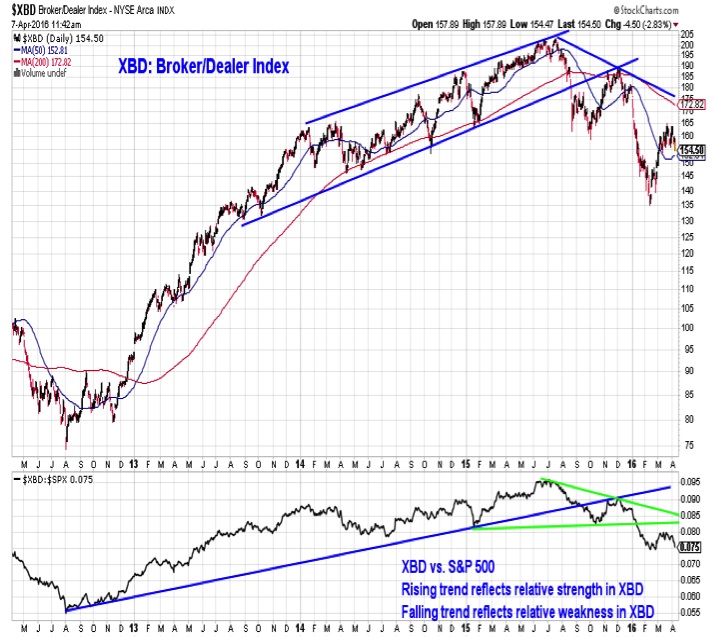
Broker/Dealer Index
In some ways the weakness, on an absolute and relative basis, out of the broker/dealer index is of even greater concern than lagging small-caps. The Broker/Dealer index is usually a reliable leading indicator for the broad market, and right now it is barely clinging to is 50-day average – the 200-day is almost out of sight and $XBD is still down double digits on a year-to-date basis.
Sector Trends & Market Breadth
The early improvement in sector-level price, market breadth and momentum trends (aggregated in the chart to the right) led the gains in the S&P 500 as it moved higher off of its February low. Now, even as the S&P 500 rallied last week, sector-level trends started to cool. This would suggest the increased likelihood of a more significant consolidation/ pullback than what we have seen over recent weeks.
continue reading on the next page…
: Creating Bullish Divergence?")


: Creating Bullish Divergence?")