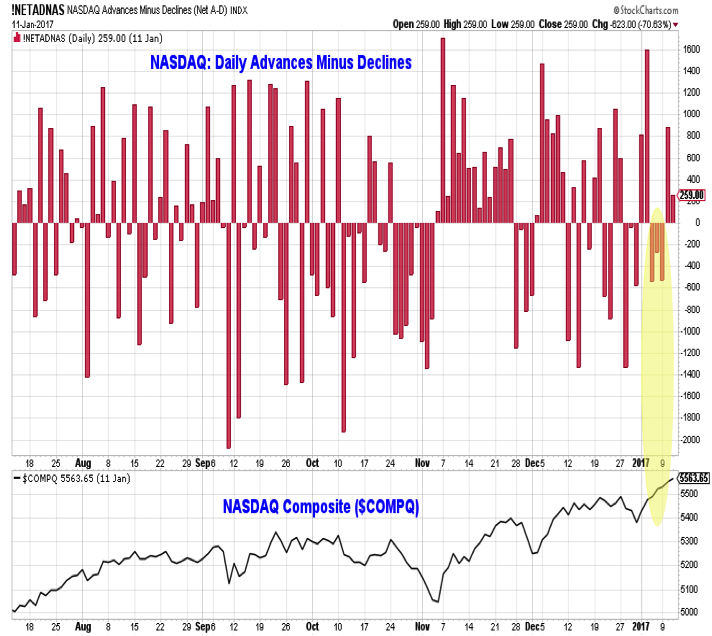
NASDAQ Composite
Even where the indexes are showing some strength, conditions beneath the surface look more suspect. The NASDAQ Composite (INDEXNASDAQ:.IXIC) has gotten off to a hot start in 2017, but it has also seen a stretch of three consecutive days on which the index made a new all-time high but there were more declining issues than advancing issues. And on both the NASDAQ and the NYSE the new high list has remained relatively narrow.
Small Business Sentiment
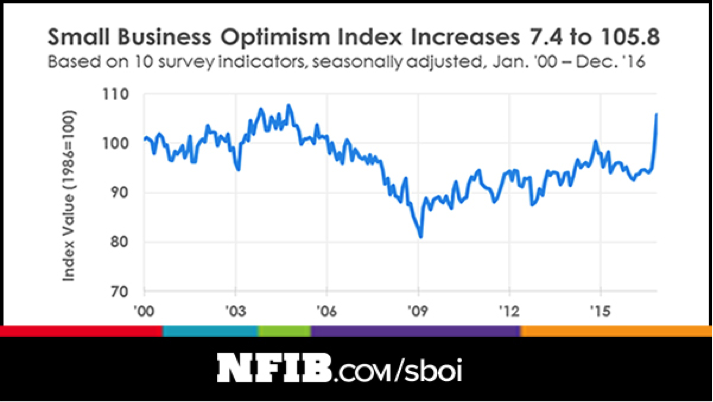
Accompanying the elevated investor optimism has been a recent surge in economic optimism. This has been seen in surveys of CEO Confidence and Gallup data. This week it appeared in the NFIB Small Business Optimism index, which surged in December to its highest level in over a decade. While investor optimism tends to limit upside for stocks, surging economic optimism has tended to be a tailwind for stocks, as the table to the left shows. After past increases in the NFIB data similar to what was seen in December, the S&P 500 has seen well above average returns (especially over the next 3 to 6 months).
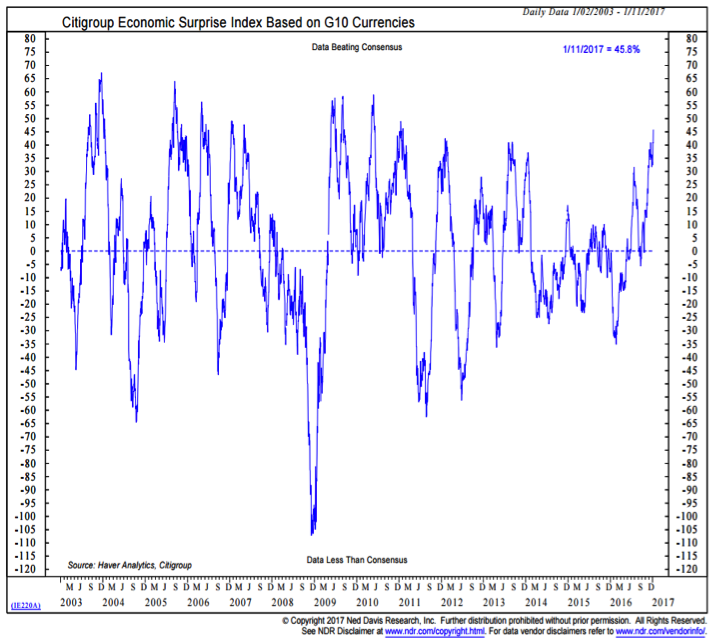
Increased economic optimism is not altogether unfounded. After all, incoming data has been much stronger than expected, in both the U.S. and overseas. In fact, the Economic Surprise Index based on the G10 has surged to a multi-year high.
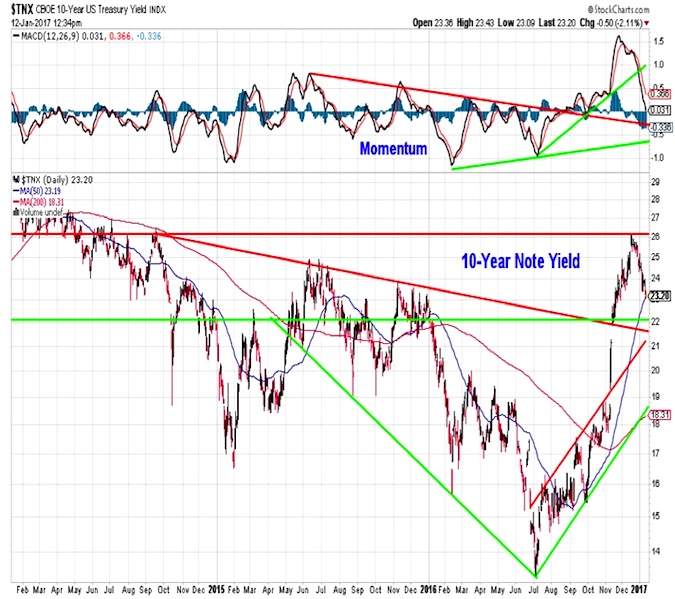
10 Year Treasury Yield
Given the upside surprises being seen in the economic data, the pullback in U.S. Treasury yields is somewhat unexpected. Sentiment may be the culprit here as well. Sentiment indicators for the bond market show excessive pessimism, helping support a rally in bond prices (and a corresponding decline in yields). Anecdotally, widespread discussion of the end of the bond bull market (and the associated publication of various levels of bond yields that would confirm the end of the bull market and/or signal the beginning of a bear market) has helped keep pessimism elevated. On top of this, yields are absorbing what was a tremendous move higher over the second half of 2016. Support for the 10-year T-Note yield (INDEXCBOE:TNX) could get more robust between 2.1% and 2.3%.
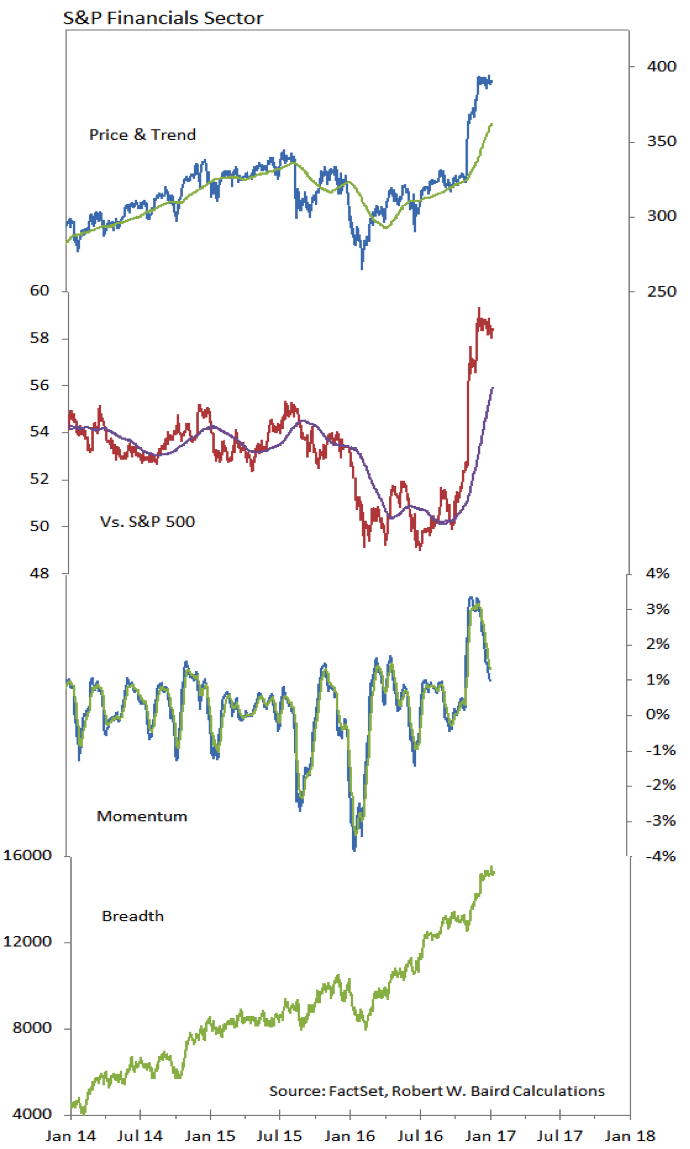
S&P Financials Sector
Given the pullback in bond yields, the Financials sector has been surprisingly resilient. It remains in the relative strength leadership group (10 weeks in a row in the top spot in the rankings) and the relative price line has not given back much after surging in the fourth quarter of 2016. Momentum has faded, but is approaching support, and breadth remains robust.
Thanks for reading.
Twitter: @WillieDelwiche
Any opinions expressed herein are solely those of the author, and do not in any way represent the views or opinions of any other person or entity.

: Showing Some Signs of Emerging Strength")

