Key Takeaways: The stock market rally off the February lows failed to produce upside breadth thrusts and narrowed into the current pullback.
The recent new highs on the NASDAQ Composite came with internal and external divergences. Global stock markets look particularly out of gear, but domestic rally participation has been lackluster as well. Sentiment indicators point to a rebound in optimism.
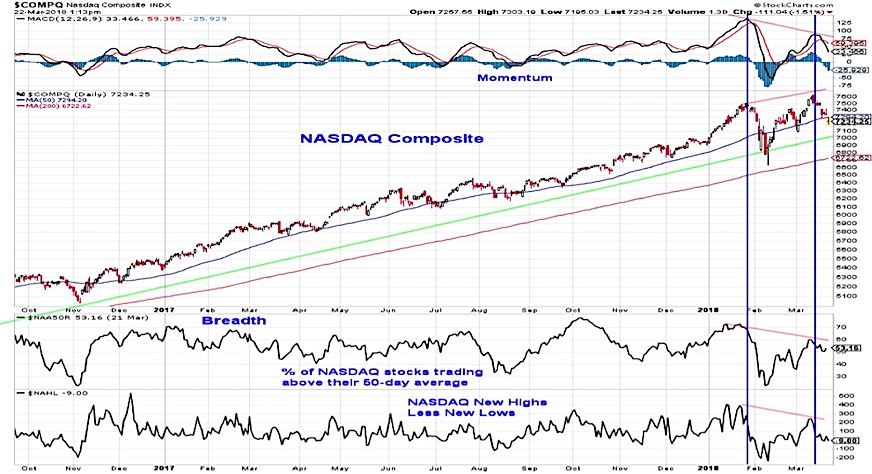
The NASDAQ Composite has been a relative price leader in 2018, and is still positive on a year-to-date basis (versus the S&P 500 which is struggling to stay in positive territory). As such, it is not too surprising that the NASDAQ would lead the way off of the February lows and toward a test of the January highs. Indeed, the NASDAQ Composite rallied to and through its January peak and was making new highs earlier this month. However, that new price high came with divergences. Momentum on the NASDAQ remained shy of its January peak and has now rolled over, as have internal breadth measures (such as the percentage of stocks in the composite trading above their 50-day averages and the number of net new highs).
These divergences are exacerbated by deteriorating broad market conditions beyond the NASDAQ itself. The rally off of the February lows has not produced a meaningful breadth thrust (measured either by the 10-day advance/decline ratio or the percentage of stocks trading above their 10-day averages) and global stocks have struggled to participate in the rally.
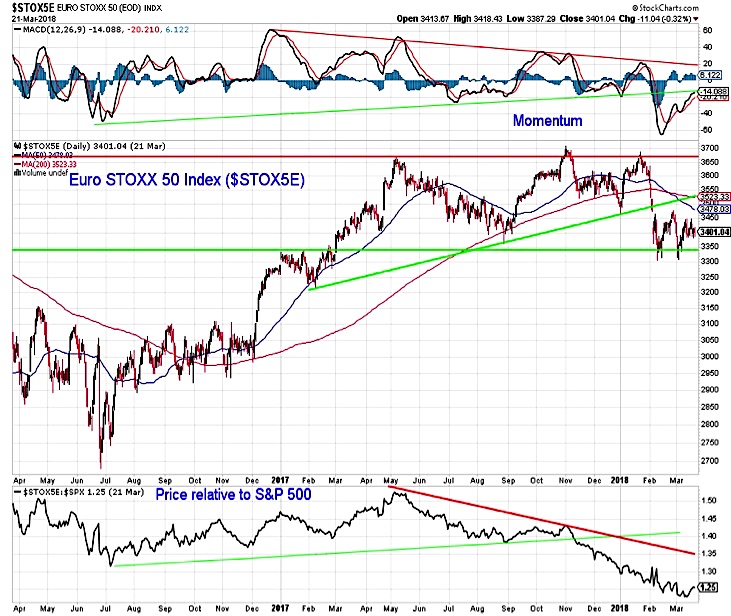
While the NASDAQ Composite was making new all-time highs just a couple of weeks ago, European stocks have been struggling to avoid making a new 52-week low. While the STOXX 50 Index managed to make higher lows over the course of 2017, higher highs were harder to come by. The pattern of higher lows was broken in February, followed by the 50-day average crossing below the 200-day average. European stocks have lost ground to U.S. stocks (as measured by the S&P 500) for almost a year now.
The Recovery Rally Generated Optimism, Not Broad Participation
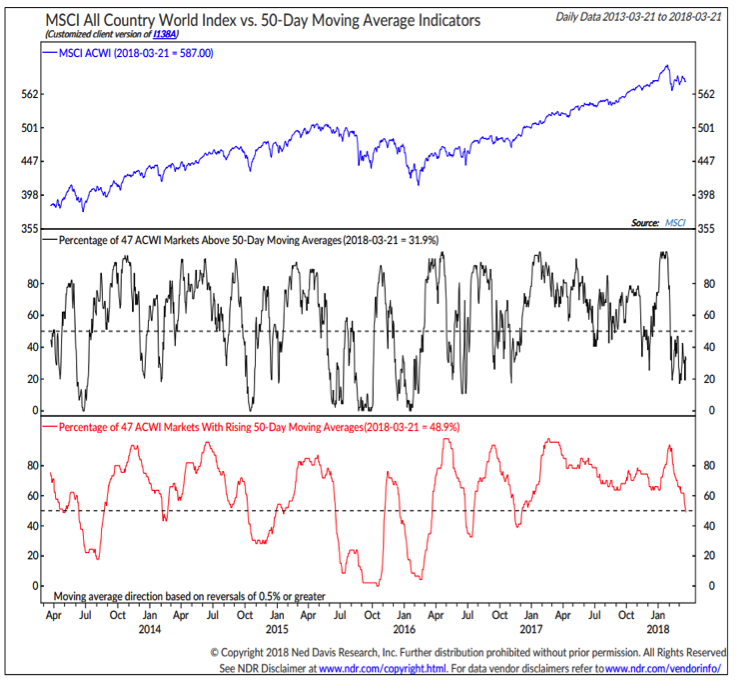
Global market weakness is not limited to just Europe, however. After seeing 100% of the markets that make up the ACWI (All-Country World Index) trading above their 50-day averages as recently as January, we now just have 32% that are doing so. It is not just that speed at which the globally based rally evaporated, but the lack of bounce that came after the initial weakness. We have not seen more than 50% of these markets trading above their 50-day moving average since the initial deterioration, and now more than half have 50-day averages that are falling. If the strongest rallies are global in nature, the weakness over the past two months has seen a blow to the health of the rally.
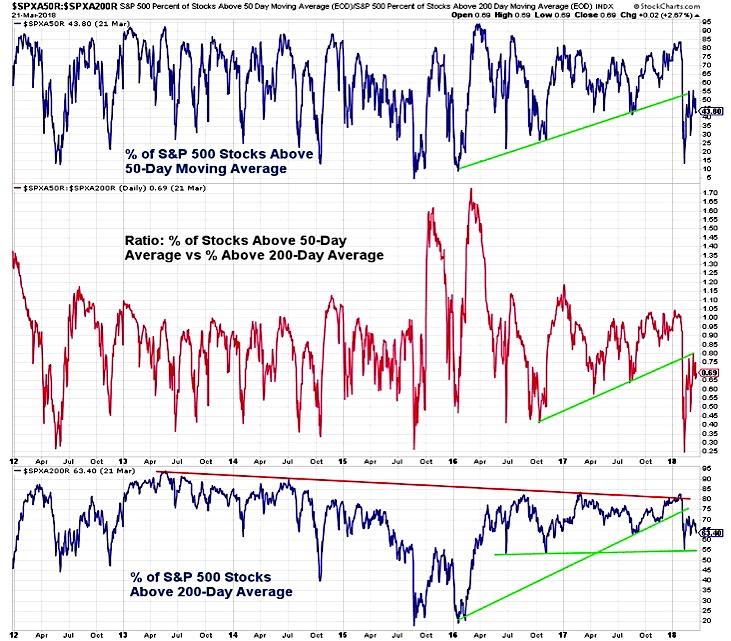
We need not look overseas for a lack of conviction in the rally that carried the NASDAQ to new highs. Neither the percentage of S&P 500 stocks trading above their 50-day averages nor the percentage trading above their 200-day averages have recovered since their late-January swoon (nor for that matter has the ratio between those two indicators).
In other words, the bounce off of the February lows has not found either global or domestic broad market sponsorship. This cast doubts on its sustainability and may mean more volatility in the near term. Seeing the percentage of S&P 500 stocks trading above their 200-day average slip below 55% would be evidence that the longer-term trends are deteriorating.
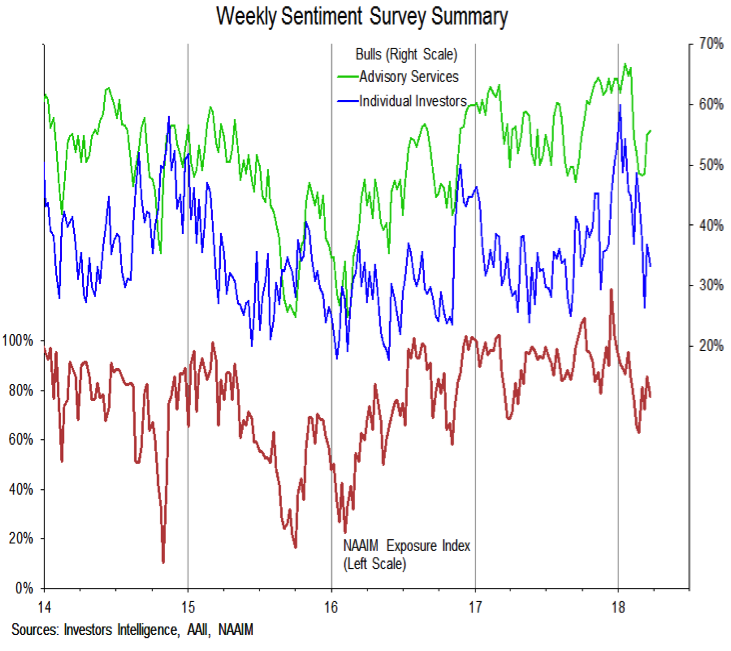
The move of the February lows has been sufficient to get investors generally more optimistic about stocks. While still shy of their previous peaks, bulls on both the AAII and Investors Intelligence surveys have climbed off of their recent lows (which were not excessively low by historical standards), as has the NAAIM Exposure Index.
Short-term sentiment measures have offered a more mixed message (depending on which indicator one chooses to look at). Our preferred measure for looking at near-term sentiment is the NDR Trading Sentiment Composite. This indicator was briefly in the excessive optimism zone this week (for the first time since early February), but has since pulled back to neutral.
Twitter: @WillieDelwiche
Any opinions expressed herein are solely those of the author, and do not in any way represent the views or opinions of any other person or entity.


