What We Are Watching
This Week’s Stock Market Outlook:
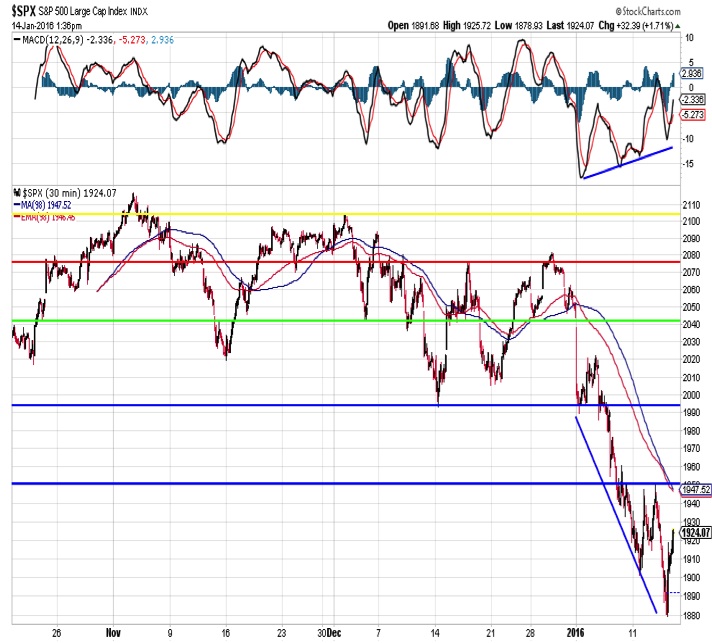
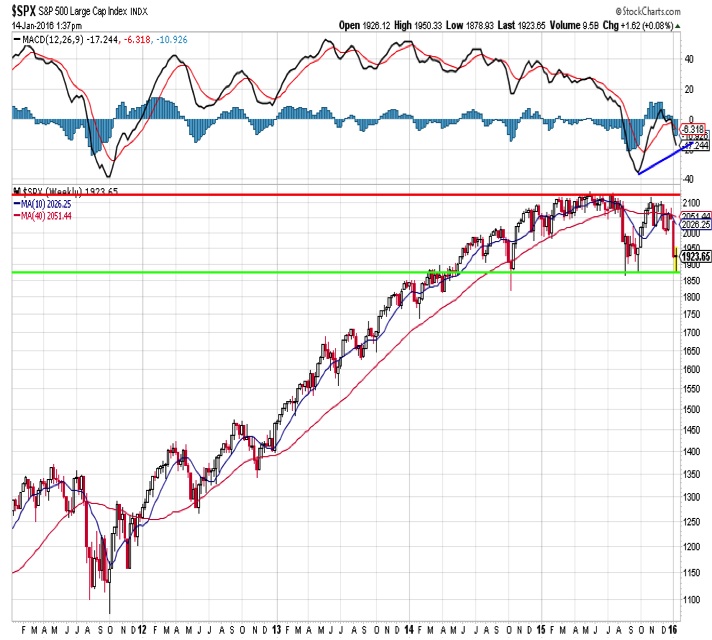
Momentum Divergences Offer Glimmer of Hope – Momentum tends to lead price at turning points. Both the intraday and weekly charts for the S&P 500 show positive momentum divergences, which could signal the worst of the early-year weakness in prices has past.
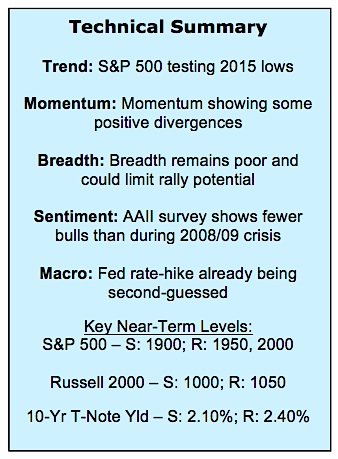
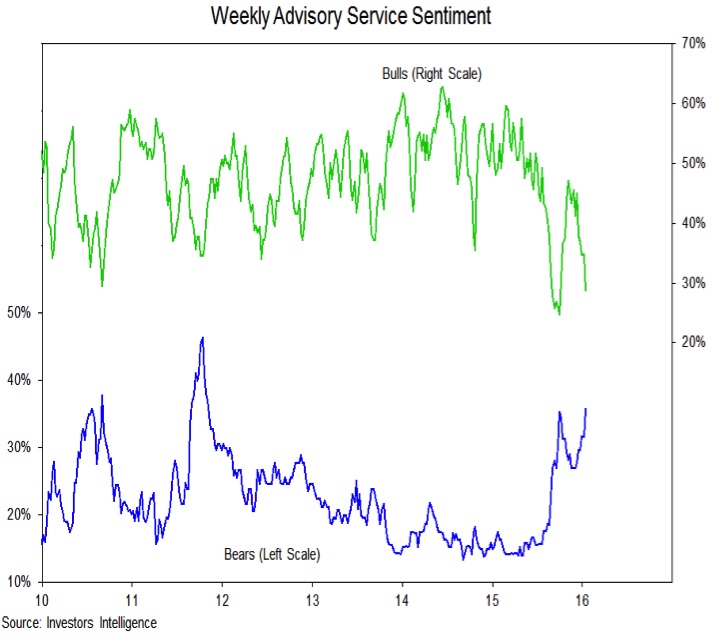
Bulls in Hiding – Investor pessimism is rampant as we have seen signs of panic and stock market bulls have gone into hiding (at a time of year when it is usually bears that are hibernating). This level of pessimism and lack of optimism could be enough to fuel a near-term rally, but how far it can carry remains to be seen.
Previous Leaders Look Out of Step – Both broker/dealers and biotechs were leaders coming into last summer and neither group has been able to get back in gear. Both are working lower on a relative and absolute basis. Leadership now is with defensive areas like Consumer Staples and Utilities. If a sustainable rally is emerging, we would expect to see evidence that broker/dealers and biotech are getting back in gear.
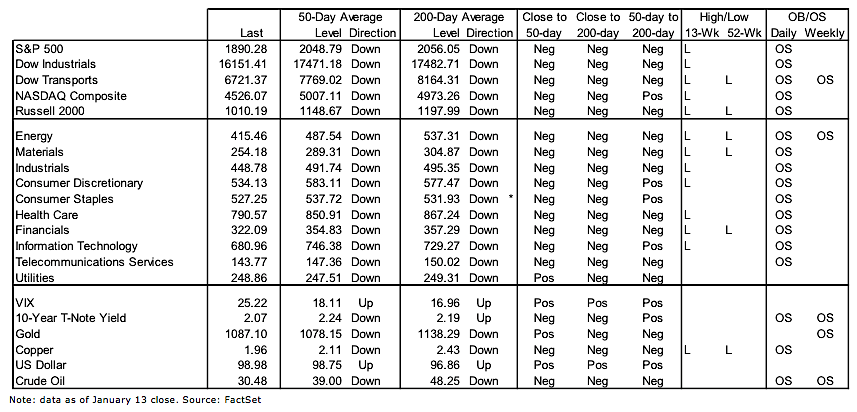
Stock Market Indicators – Indices & Sectors (click to enlarge)
S&P 500 Index
We have seen some evidence of panic selling as stock market bulls (more on sentiment in just a moment), but as prices worked lower on an intra-day basis this week, momentum (using the MACD indicator) has continued to make a series of higher lows. It is too early to have much conviction that a sustainable low is in place for the S&P 500, but the positive momentum divergence is encouraging. A clear break above 1950 would reinforce this message.
The weekly chart shows the S&P 500 again testing the bottom of the trading range that stretches back into 2014. But again is offering a hopeful message. The weekly MACD remains well-above the October 2015 lows. While a multi-year down-trend in weekly momentum is intact, making a higher low could be the first evidence of reversal.
Supporting the view that a panic low has been made is the sharp rise in pessimism being seen in the sentiment surveys. According to the NAAIM, active investment managers have cut their equity exposure in half over the past five weeks. The chart to the right shows bullish and bearish sentiment from advisory services. Bears have surpassed their 2015 peak and are at a level last seen in 2011. For perspective, last year at this time the Investors Intelligence survey showed 48% stock market bulls and 16% bears. Now it is 29% bulls and 36% bears.
continue reading on the next page…
: Creating Bullish Divergence?")


 and Semiconductors (SMH): Concerning Price Pattern?")


