CORN SUMMARY FOR THE WEEK ENDING 3/4/2016:
It was gut check time this week for Corn Bulls with December 2016 corn futures establishing successive new contract lows on Tuesday and Wednesday. Wednesday’s day low of $3.73 ¼ now represents the current contract low in December corn futures. Prior to this week the contract low in December corn futures (CZ6) was $3.74 ½, which came on January 7th.
The good news for Corn Bulls however… CZ6 managed to rally back into the end of the week finishing on Friday at $3.78. Therefore versus the December corn futures close on 2/26, CZ6 only closed down a ¼-cent per bushel week-on-week despite having to endure heavy selling pressure Monday through Wednesday.
Corn futures spent the majority of the week on the defensive, still reeling from the USDA’s Ag Outlook Forum and their 2016/17 U.S. corn S&D estimates. In that report the USDA issued a planted acreage forecast of 90 million acres (+2 million versus 2015/16) and ending stocks of 1,977 million bushels (+140 million versus 2015/16). That said from an analog supply and demand comparison, 2016 corn prices are now likely to act very similar to a year ago during the March through June timeframe (see 2015 July corn futures chart on page 3). In the 2015 February WASDE report U.S. corn ending stocks (2014/15) were estimated at 1,827 million bushels and incorporated a stocks-to-use ratio of 13.4%. In last month’s 2016 February WASDE report U.S. corn ending stocks (2015/16) were forecasted at 1,837 million bushels versus a stocks-to-use ratio of 13.6%. Therefore the market set-up heading into the 2016 spring planting season is nearly identical to a year ago.
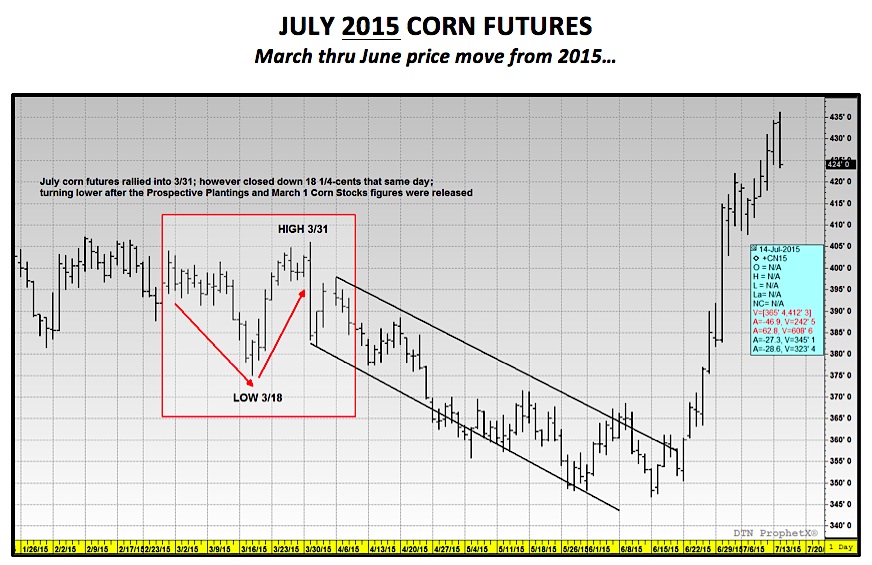
I think it’s important to point out that in March – June of 2015 the price action in corn futures was largely counter-seasonal relative to both the 5 and 10-year trends, which means corn futures DID NOT rally out of the March Prospective Plantings report and into and through the end of April/May. On the contrary corn futures prices weakened from a day high in July 2015 corn futures of $4.06 on 3/31/15 to a day low of $3.46 ¾ on 6/15/15. What were the key catalysts contributing to the counter-seasonal, sideways-to-lower price action a year ago?
Large Carryin Stocks
More than Adequate Planting Intentions
? No Significant Planting Delays
With 2016/17 U.S. corn carryin stocks currently projected to exceed 1,800 million bushels (which is higher than last year’s 1,731 million bushel beginning inventories) and planted acreage approaching 90 million corn acres, the market has already largely eliminated two of the three primary supply-side concerns heading into the 2016 planting season. Therefore outside of a major Bullish acreage surprise in the March 31st Prospective Plantings report, traders will likely remain extremely patient before embracing a legitimate spring planting delay (1st week of May at the earliest). Furthermore the other disadvantage for Corn Bulls is that Money Managers are now also aware of the U.S. farmer’s ability to collectively plant millions of acres in a very small period of time. 2015 provided a memorable example of this with the U.S. corn crop going from just 19% planted on April 26th to 75% planted on May 10th. Therefore, what appeared to be the start of a tangible planted acreage delay was eliminated in only two weeks. All of these factors will likely continue to work against corn futures being able to sustain large rallies over possibly the next 90 days.
CURRENT CORN PRICE EXPECTATIONS:
I still believe July corn futures can rally into the March 31st Prospective Plantings report even with a Bearish fundamental U.S. corn S&D outlook. However the key questions are…from what price level and how high? I’m still going to lean heavily on last year’s July corn futures price action during the month of March because of the aforementioned supply-side similarities to 2016. From 3/2/15 through 3/18/15 July corn futures broke 28-cents from high-to-low ($4.03 to $3.75). However from the day low on 3/18/15 through 3/31/15 July corn futures rallied back 31-cents, establishing a day high of $4.06 the morning of the 2015 planting intentions report. Therefore the challenge for Corn Bulls a year ago was essentially patience and having to endure considerable selling pressure during the first 18 days of the month. The other glaring reality for farmers specifically in 2015 (for those who had planned to use the March rally to price a percentage of their new-crop corn production); producers were forced to wait through a relatively large correction, all for an opportunity to sell July corn futures 3-cents per bushel better than the day high on March 2nd. Not to mention after posting that early session day high on March 31st, 2015 of $4.06 July corn futures rolled over, finishing down 18 ¼-cents per bushel at $3.84 ¼. Therefore the penalty for not selling corn, at just the right time was substantial. It’s also worth noting that the market then continued to work largely sideways to lower all the way into June. This is how fragile spring markets can be when they lack a compelling carryin stocks or acreage concern.
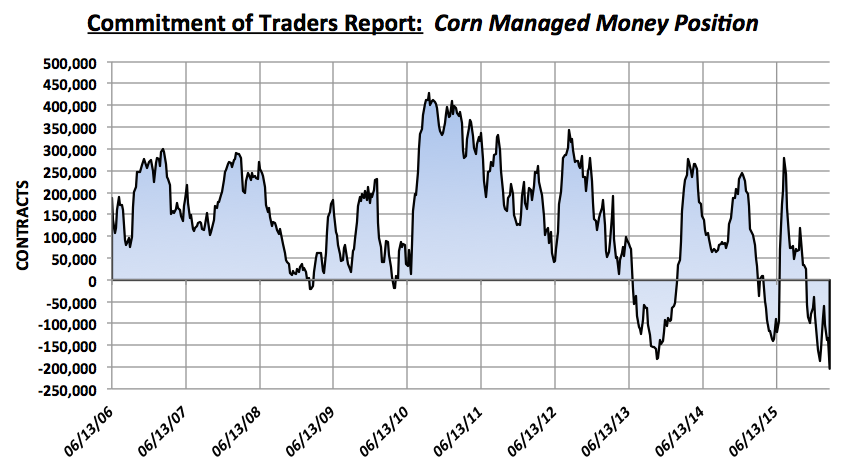
However the one thing that Corn Bulls have in their favor at the moment is that July corn futures fought off new contract lows mid-week, eventually closing higher on Friday. Technically that should be viewed as mildly supportive. Also of note, Friday’s Commitment of Traders report showed Money Managers aggressively increasing their net short position to a new record of -203,837 contracts. That position stands in stark contrast to a year ago. On March 3rd, 2015 Money Managers were NET LONG over +50,000 contracts. Therefore in 2015 they held sizable downward position exposures going into the spring. This year it’s just the opposite. The argument could be made Money Managers have already discounted the market too far given it’s only the first week of March. This too should be supportive to corn futures in early March, which was not in play a year ago. Technically, CN6 needs to hold the new contract low of $3.59; however assuming it does, the market could gravitate back toward the $3.85 level over the next two weeks. That said I would still be cautious of additional price weakness after the March 31st Prospective Plantings report.
Thanks for reading.
Further reading from Marcus: “US Ag Forum Sheds Light On Corn Market“
Twitter: @MarcusLudtke
Author hedges corn futures and may have a position at the time of publication. Any opinions expressed herein are solely those of the author, and do not in any way represent the views or opinions of any other person or entity.
Data References:
- USDA United States Department of Ag
- EIA Energy Information Association
- NASS National Agricultural Statistics Service

: Cup (and Maybe Handle) Watch")
 Reaches Important Price Support")

