Corn Summary For The Week Ending 2/26/2016:
The market focus this week was primarily on the Ag Outlook Forum, which ran from Thursday through Friday in Arlington, Virginia. This annual conference held in February has traditionally served as the starting point for initial discussions concerning the new-crop U.S. corn and soybean S&D tables, and in particular, the USDA’s spring planted acreage assumptions. The discussions help build a framework for where December corn futures may be headed.
USDA Chief Economist, Robert Johansson, presented early Thursday morning and offered a number of insights on crop specific acreage allocations and pricing forecasts for 2016. U.S. planted corn acreage was estimated at 90 million acres versus 88 million in 2015 and the average trade guess of 89.6 million. U.S. planted soybean acreage was estimated at 82.5 million acres versus 82.7 million in 2015 and the average trade guess of 83.3 million. Neither forecast was deemed momentum changing. If anything, both acreage projections appeared to validate current market sentiment, which is December corn futures are likely to continue facing considerable resistance this spring and early summer barring a significant weather-related planting delay.
Adequate acreage, surplus carryin stocks, and trend-line yield assumptions coupled with a stagnate forward demand curve in both corn and soybeans equates to current 2015/16 U.S. ending stocks essentially being walked forward another year.
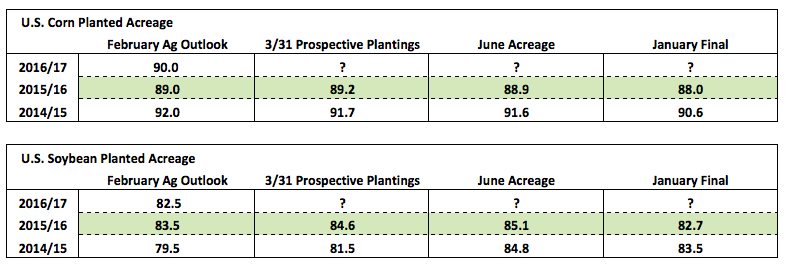
Is there a tangible relationship between the USDA’s February Ag Outlook planted acreage estimates and their March 31st Prospective Plantings figures? In corn there hasn’t been much of an adjustment from February to March over the last two years (see full table below). In 2015 the USDA’s 3/31 corn prospective plantings estimate was+200,000 acres versus the Ag Outlook forecast. In 2014 the 3/31 figure was -300,000 acres versus February. In soybeans the planted acreage variances have been more notable with 2015 March 31st soybean prospective plantings estimated at 84.6 million acres versus the Ag Outlook forecast of 83.5 million. In 2014 the 3/31 figure was an even greater +2.0 million acres versus February. Therefore based on the last 2 years, the trade’s likely to anticipate a 3/31 corn acreage estimate very close to Thursday’s 90 million acres and a soybean acreage projection that’s closer to the pre-report average trade guess of 83.3 million versus the Ag Outlook figure of 82.5 million.
Other Key Takeaways from the USDA’s Ag Outlook FORUM:
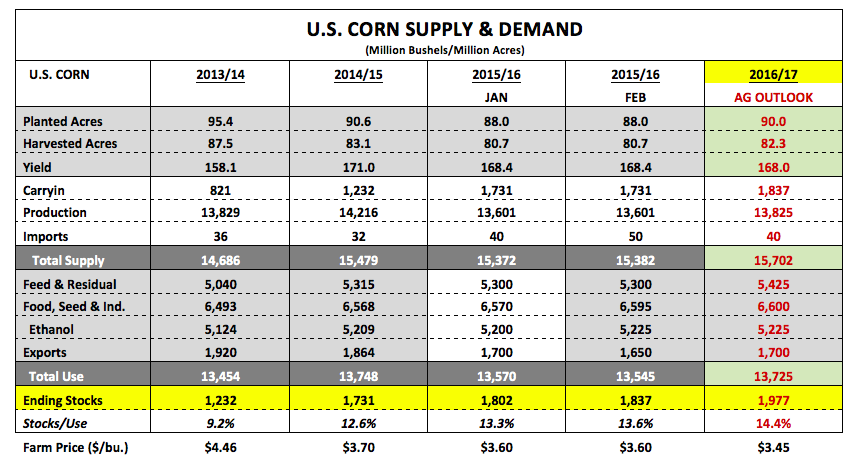
U.S. Corn 2016/17 Balance Sheet – In the USDA’s Grains and Oilseeds Outlook summary they issued relatively generic yield and usage projections not dissimilar to 2015/16. Ending stocks were estimated at 1,977 million bushels via a U.S. corn yield of 168 bpa (versus 168.4 in 2015) and total U.S. corn demand of 13,725 million bushels. The USDA did acknowledge continued export competition from Brazil and Argentina, as well as increases in fuel economy offsetting lower gasoline prices, as two key obstacles to material demand growth in exports and corn-ethanol use in 2016/17. U.S. corn exports were estimated at 1,700 million bushels, up just 50 million from 2015/16, with corn-ethanol use unchanged at 5,225 million bushels.
- CHINA – The USDA lowered its GDP growth forecast for China versus its 2015 projection through 2025. Also Chinese net imports of soybeans, grains, and cotton are still expected to rise but not as significantly as last year’s projection. China remains the world’s largest importer of soybeans with 2015/16 imports estimated at 80.5 MMT. Approximately 60% of all U.S. soybean export sales from crop years 2013/14 – 2014/15 were to China.
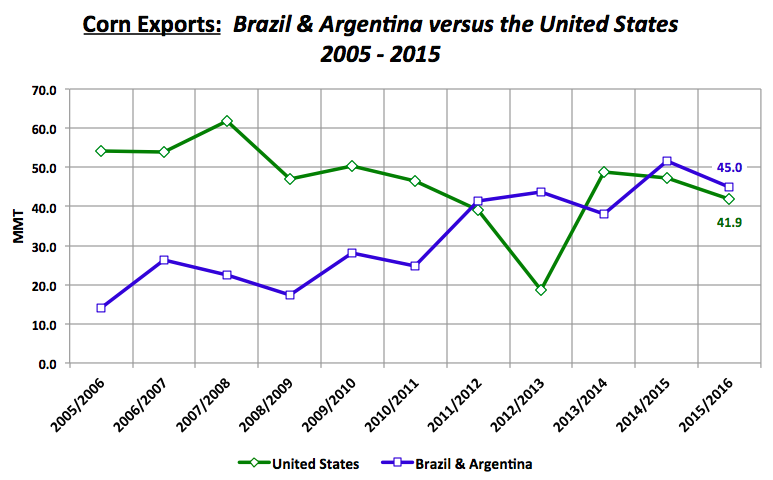
- BRAZIL EXPORTS – The USDA increased its export projection for Brazilian corn and soybeans versus its 2015 projection through 2025. Brazil continues to produce record to near record corn and soybean crops almost annually. Brazil’s 2015/16 corn crop was last estimated at 84 MMT in the February 2016 WASDE report, just 1 MMT below last year’s record. Meanwhile, Brazil’s 2015/16 soybean crop was estimated at 100 MMT, 3.8 MMT ABOVE last year’s record. Specifically as it relates to soybeans, Brazil has stormed past the United States as the largest exporter in the world (see chart on page 3). Brazil’s combination of rapidly expanding production potential coupled with a weak domestic currency has given it a distinct export advantage over the United States.
U.S. SOYBEAN 2016/17 Balance Sheet – The USDA projected 2016/17 U.S. soybean production of 3,810 million bushels via a yield of 46.7 bpa on 81.6 million harvested acres. The USDA’s yield was slightly under the last 2 years, which both featured record yields for their respective crop years (2014/15 = 47.5 bpa and 2015/16 = 48.0 bpa). On the demand side of the equation, the crush was increased to 1,900 million bushels with exports raised to 1,825 million (+135 million versus 2015/16). 2016/17 U.S. ending stocks were projected to fall 10 million bushels year-on-year to 440 million. The export increase in particular feels aggressive and overly optimistic given Brazil’s 2015/16 record-setting soybean crop. Furthermore, I see no indication of their soybean production decreasing (via a planted acreage decrease) in 2016/17 unless weather becomes an issue. Therefore Brazil’s strong influence in the export market should continue to provide consistent competition for the United States in the new crop-year.
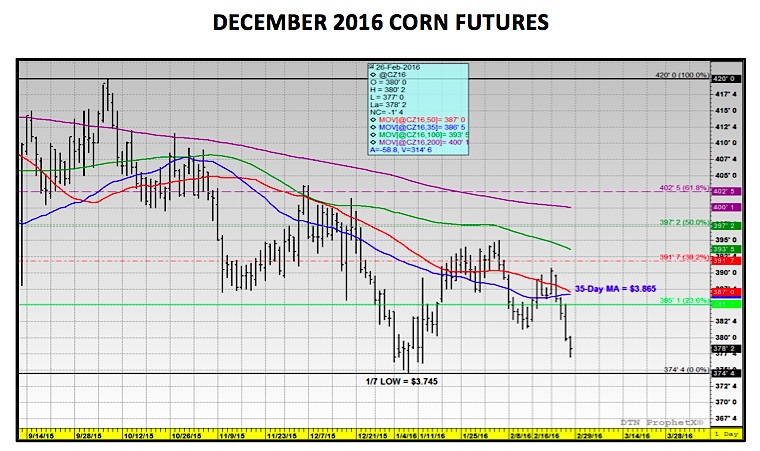
CORN Futures – Current Price Considerations: May corn futures closed down 9 ¾-cents per bushel week-on-week, finishing at $3.59½ on 2/26. After momentarily trading up and through the 50-day moving average Monday morning, corn prices abruptly gave way to a new wave of sell paper. I have little doubt the selling was in large part inspired by traders pre-positioning in front of the USDA’s Ag Outlook 2016/17 U.S. corn S&D forecast, with the majority anticipating a Bearish report (S&D figures were published on Friday). Clearly the USDA did not disappoint with its planted acreage estimate of 90 million acres (2 million acres higher than 2015) and an ending stocks forecast of nearly 2.0 billion bushels.
Friday’s Commitment of Traders report actually showed money managers net buyers of 3,602 contracts versus a week ago; however that number was as of Tuesday’s close. Most of the selling came Wednesday through Friday with May corn futures closing down 7 ¼-cents during that 3-day window. Therefore I’m going to assume next week’s report will show the managed money net short once again in excess of -150,000 contracts (currently -134,334 as of the 2/23 market close).
Technically, Corn Bulls need to see May corn futures hold the current 2016 low of $3.54 ¼ this week, which was established on January 7th. At the moment I’m struggling to find any tangible, fundamental justification for an immediate recovery in corn prices. That said I still believe rallies will eventually evolve as U.S. springtime weather becomes more and more of a talking point in April and May.
Thanks for reading.
Twitter: @MarcusLudtke
Author hedges corn futures and may have a position at the time of publication. Any opinions expressed herein are solely those of the author, and do not in any way represent the views or opinions of any other person or entity.
Data References:
- USDA United States Department of Ag
- EIA Energy Information Association
- NASS National Agricultural Statistics Service

 Trading Near Top Of Price Range")


