Trading is one of the few areas where people believe a small amount of knowledge or simplicity will immediately make them money. As a result, many traders early in their careers tend to seek out overly simplistic advice and guru’s who make the process seem easy. I’m certainly not advocating for complex systems, just making an observation.
Successful traders synthesize multiple disciplines, styles, and types of information in a way that makes sense for them. There are always common themes, but the common themes are less important than the personalized synthesis. However, successful synthesis requires exposure to multiple ideas, an understanding of self, and an insatiable desire to learn and improve.
Ultimately, successful trading requires an understanding of yourself and the development of a strategy or strategies that fit your personality. There are no short cuts.
It recently came to my attention that those catchy pictures with words on them are called “memes.” Let’s be very clear about something… just because a site puts together a bunch of catchy memes and has a large following does not mean that they trade successfully. I recognize that intuitively we all know this, but there’s still a significant amount of attention being paid to simplistic advice that won’t lead to successful trading.
One of the historically great traders, Ed Seykota, says that everyone gets what they want out of markets. My belief is that the success of memes is due to people’s desire for successful trading to be simple, quick, and easy.
My goal in the markets has always been and continues to be successful trading. As a result, I seek to associate with other successful traders. When I visit a site or talk to a trader one of the first things I look for is a track record of some sort. If I was looking for entertainment, I’d look for the best memes. The reality is that all of those pretty sites with catchy memes don’t matter as much as results.
On to the markets…
The intraday price action this week was mostly choppy and slow. With the exception of Wednesday, the market has had a series of gaps higher without a lot of continuation or heavy intraday buying. That type of price action gives us reason to question the strength of the rally, but it doesn’t tell us anything about the timing of if or when it might fail. We look at multiple timeframes to get a sense for what the market is doing, but our job as non-directional traders is to react to the market rather than predict.
The longer term trend in the markets remains bearish with a shorter term positive trend. We look to the weekly and daily charts for a sense of longer term direction and pay close attention to the 65 minute chart for an idea of what might play out in the next week or two. Right now the shorter term trend remains positive and the market has not given us any reason to expect a reversal. That environment will continue until it changes and “resistance” on the longer term charts is only potential resistance until after the fact.
Sadly the most obvious reason to question the broader negative picture is that the recent rally seems very disliked. I’d feel more confident in the decline if the sentiment seemed more bullish.
Volatility:
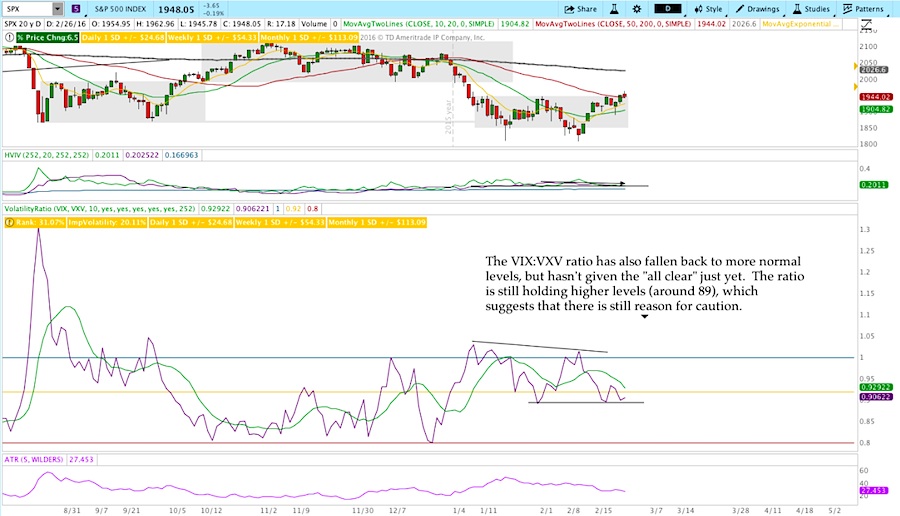
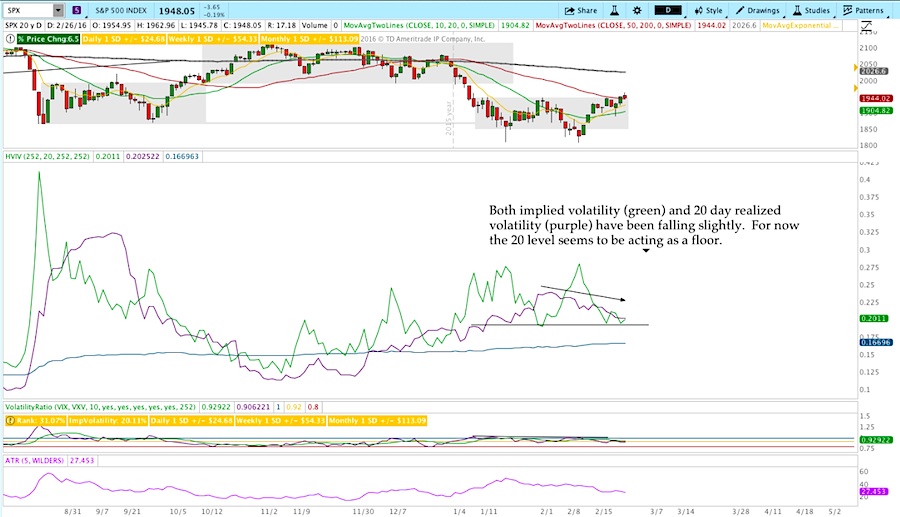
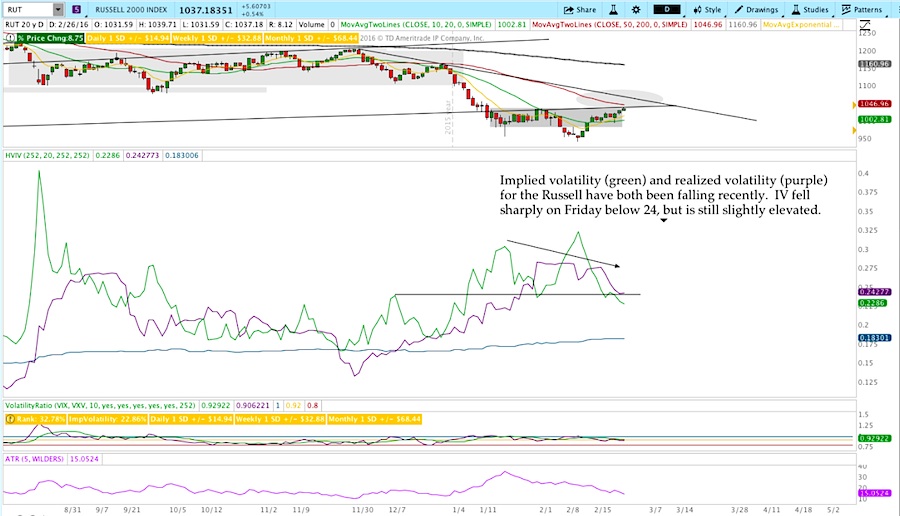
Volatility has been reluctantly heading lower and seems to be validating what we’re seeing in price. Specifically, the market has been displaying some short term strength within the context of a primary downtrend and volatility has come off from a state of concern to caution. We haven’t seen any sort of panic in 2016 and volatility has validated that all year.
S&P 500 vs VIX:VXV Ratio
S&P 500 – Implied Volatilily vs Realized Volatility
Russell 2000 – Implied Volatility vs Realized Volatility
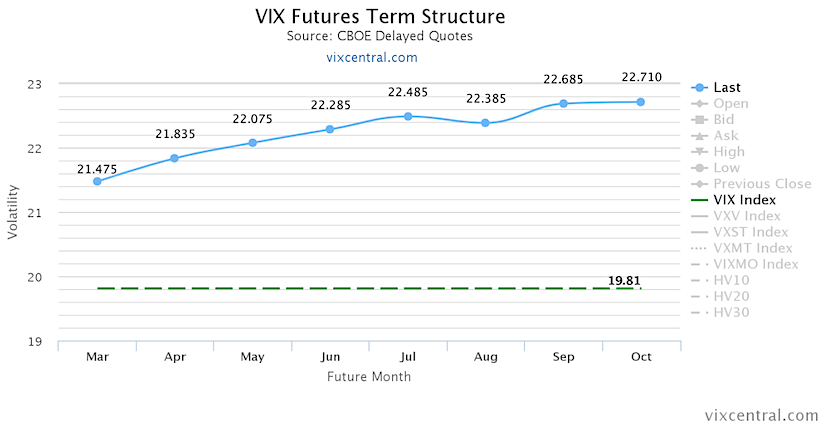
The VIX Futures curve remained in Contango this week. The curve steepened slightly from last week as the market moved higher.
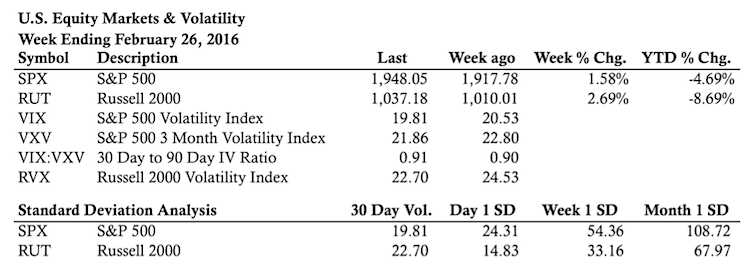
Market Stats:
Thanks for reading and good luck in the week ahead.
Twitter: @ThetaTrend
Author holds positions in related securities at the time of publication. Any opinions expressed herein are solely those of the author, and do not in any way represent the views or opinions of any other person or entity.


 Analysis: Bulls Eye Down-Trend Line")


