“If it wasn’t this, it’d probably be something else . . . ” – A line from Elizabethtown. Yes, I’m embarrassed to quote a cheesy, mainstream romantic comedy and, sadly, it’s the most fitting quote for today.
And on that, all I’ll say is that I’m sure glad that it’s over with. For many (if not most or all) non-directional options traders, 2016 has been a tough year.
The month of March just ended and from a trading standpoint it was good even though the move higher and steepening ATM skew have created a more difficult trading environment. But that is why we follow our risk guidelines.
The Big Picture: Do emotions get in the way of following trading setups and market indicators?
The other day I was thinking about the markets, economics, politics, and, of course, the steady state of decline. Surely, you weren’t hoping for something more rosy this morning…
At any rate, when the market goes against us it’s easy to get upset with the factors that “drive” the market. Specifically, I want to be mad at ‘ol Janet and blame her for making it challenging to carry short delta positions. Additionally, I hate our political environment and the fact that politicians are effectively above the law. At the same time, we’re here to trade and what matters on a day to day basis is the market. As far as that goes there’s always going to be something and if it wasn’t this, it would definitely be something else.
As human beings we have a tendency to want to identify the cause of our pain or suffering. When things don’t go our way, we like to blame someone or something for that outcome. Anger is a curious emotion. From a trading standpoint, the best things we can do are step back, be humbled, learn from the lesson, and move forward. The causes of the market environment matter in a life sense, but they don’t matter in a trading sense. Our goal is to make positive expectancy decisions regardless of what’s going on rather than to become frustrated about why things are happening.
On that notion of why, it’s hard to understand what’s driving the market higher. For the time being, we haven’t seen any signs of short term weakness and all we can do is monitor previous support for potential breaks. On the upside, we can continue to look at potential resistance areas, but those levels are only potential until they hold.
Volatility:
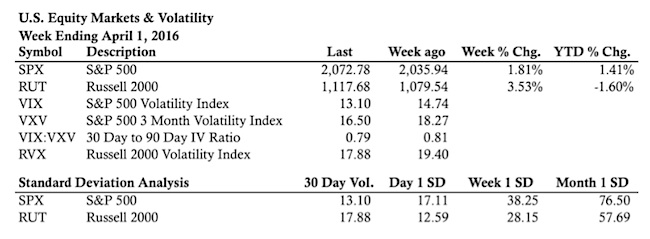
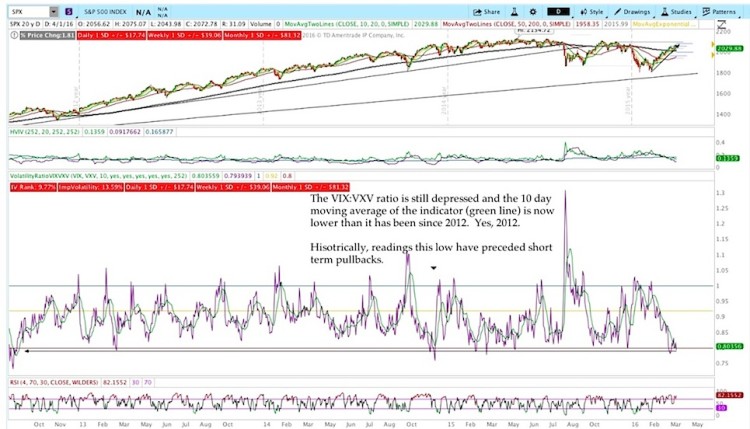
At this point, the only glimmer of hope for a pullback comes from the now very depressed volatility and other volatility market indicators and ratios (VIX:VXV). Until we see some support failures on the shorter term timeframes, all we can expect is more of the same.
The VIX:VXV ratio is extremely low and the 10 day simple moving average of the ratio is the lowest is has been since 2012. When we’ve seen volatility ratios this depressed, pullbacks have tended to follow. While that outcome is possible, we haven’t seen any sings on the shorter-term timeframes to indicate that it’s happening.
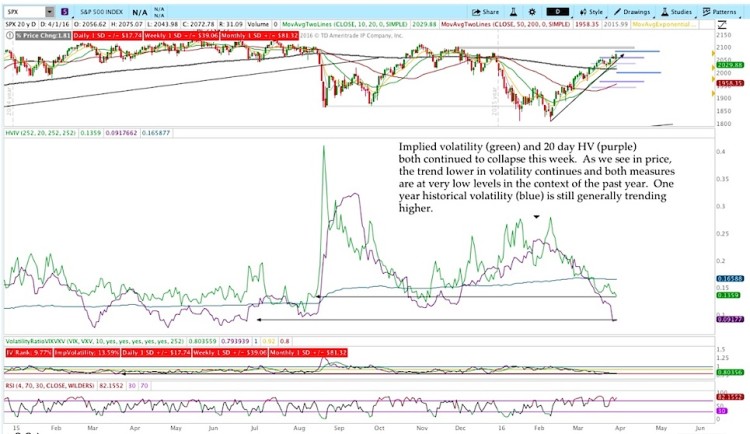
The slight increase in the IV – HV spread that we saw last week widened a little more this week as both IV and HV continued lower. Similar to the VIX:VXV ratio, both are at very low levels in the context of the past year.
Thanks for reading and have a great week ahead.
Twitter: @ThetaTrend
The author holds positions in mentioned securities at the time of publication. Any opinions expressed herein are solely those of the author, and do not in any way represent the views or opinions of any other person or entity.


