The stock market has been on fire to start the year, giving investors reason for relief… and some joy.
But be careful not to get too giddy here. This rally comes off of a sharp 20 percent correction, and it’s highly likely that the first half of 2019 will experience much more volatility.
The major market indices have shown some constructive behavior, but are nearing key technical price resistance levels.
The S&P 500, Nasdaq and Russell 2000 have taken out the 38.2 Fibonacci retracement level, 50 day moving average, and are now testing the 50 day fibonacci retracement. One level at a time.
No one knows exactly how to time volatile markets, so it’s best to have a system. Mine is not perfect but it’s highly technical and offers me target levels to trim exposure (trim and trail). EVERY investor/trader is different and needs to apply any given analysis to THEIR timeframes.
We are on watch for news about the government shutdown, US China trade deal, and the the latest Brexit plan (any/all of these could have news this weekend). Will the market “sell the news”? Having a plan helps us to operate without emotion. No what-ifs.
Today we offer a quick glimpse at the major stock market indices: the Nasdaq Composite, S&P 500 Index, and Russell 2000. Again, my analysis is technical and “aware”. The charts
Note that the following MarketSmith charts are built with Investors Business Daily’s product suite. I am an Investors Business Daily (IBD) partner and promote the use of their products. The entire platform offers a good mix of technical and fundamental data.
The charts are annotated so I’ll let them stand on their own.
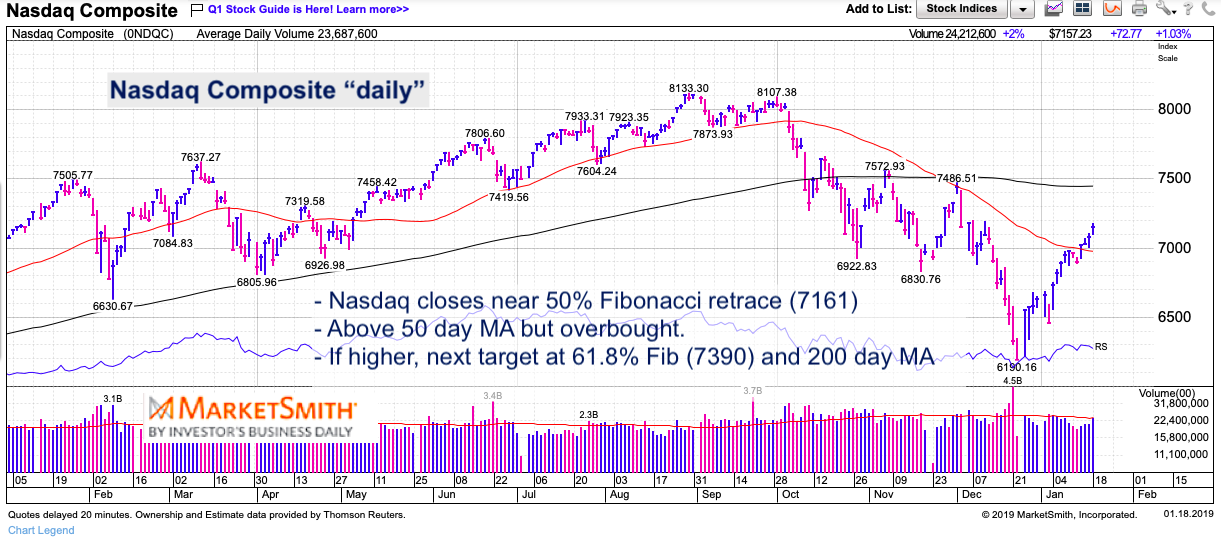
Nasdaq Composite “daily” Chart
Like the S&P 500 Index, the Nasdaq Composite is 2 bars past a 9 sell setup. The rally is V shaped thus far, but there is still much to prove (i.e. construction requires a higher low).
S&P 500 “daily” Chart
The broad stock market index has rallied 14 percent off the December 26 lows. A pullback or consolidation is overdue. What happens on the next pullback is important (i.e. bulls need to see a higher low). Every investor has to have a plan. And those plans must include a means for managing risk and a pathway (i.e. rules) for getting into and out of the market.
I tweeted out some key levels to watch on the S&P 500 on Thursday evening:
$SPX S&P 500 short-term trading update. #IBDpartner
Touched 50 Fib (2643) today. Downtrend line and 61.8 Fib (2713) could be next, but pullback should come first. “Daily” sell setup recorded yesterday. @MarketSmith — https://t.co/zm4F25Sd39 pic.twitter.com/McPhDnkBBc
— Andy Nyquist (@andrewnyquist) January 18, 2019
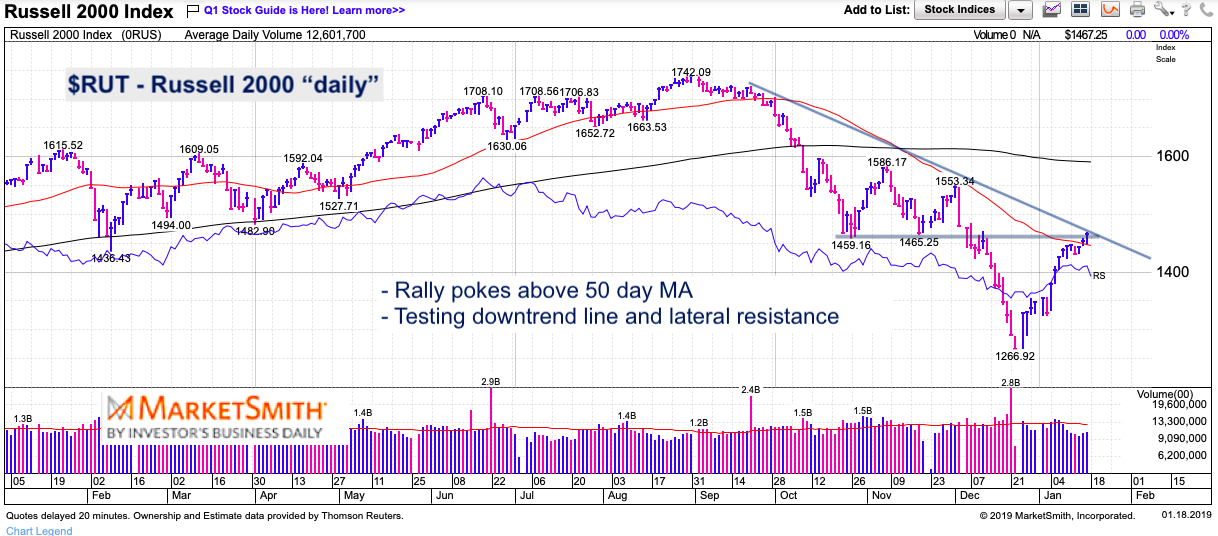
Russell 2000 “daily” Chart
The Russell 2000 peaked first and lead the market correction lower… bulls need this “high beta” small cap index to lead the market higher. Tech and small caps are great indicators of investor appetite. They are at resistance now. Put them on your radar.
Trade safe and have a plan that follows your given timeframe.
Twitter: @andrewnyquist
The author does not have a position in mentioned securities at the time of publication. Any opinions expressed herein are solely those of the author, and do not in any way represent the views or opinions of any other person or entity.


