Since we came back from vacation, I wrote 3 Daily’s.
The first one was on the Economic Modern Family and how it opened its loving arms to the bulls.
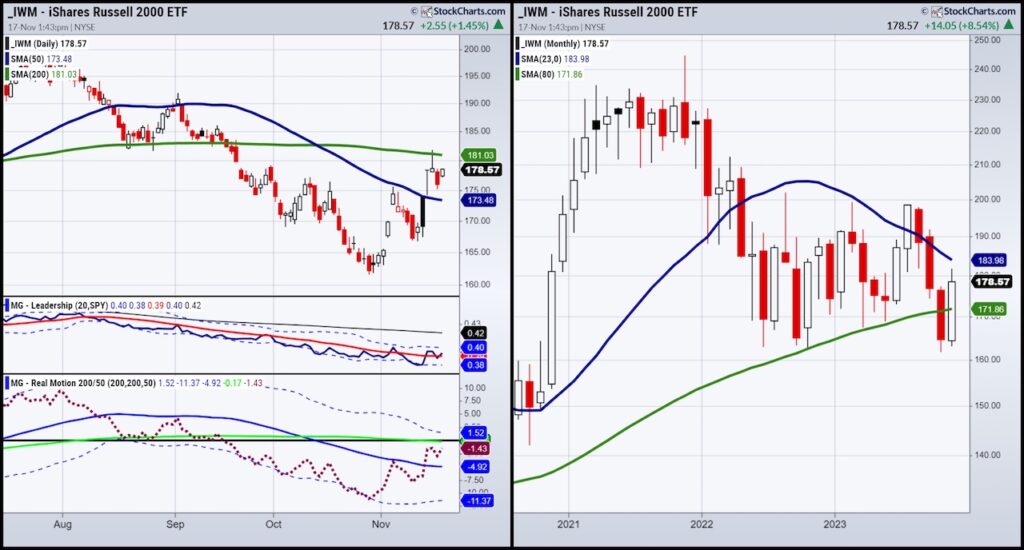
I was particularly keen on small caps or the Russell 2000 IWM.
I wrote, “Beginning with IWM or Granddad Russell 2000, Monday began with a gap up over the 50-DMA (blue).
We will watch for a phase change confirm. Furthermore, the monthly chart shows IWM back above the 80-month MA (green). Resistance at 191 area is on tap if IWM holds above 174.”
Phase change-YES
Holding 174-YES
Still above the 80-month MA-YES
Is 191 on tap if continues to hold-YES.
Next, I wrote a Daily about Soybeans as the next potential parabolic runner.
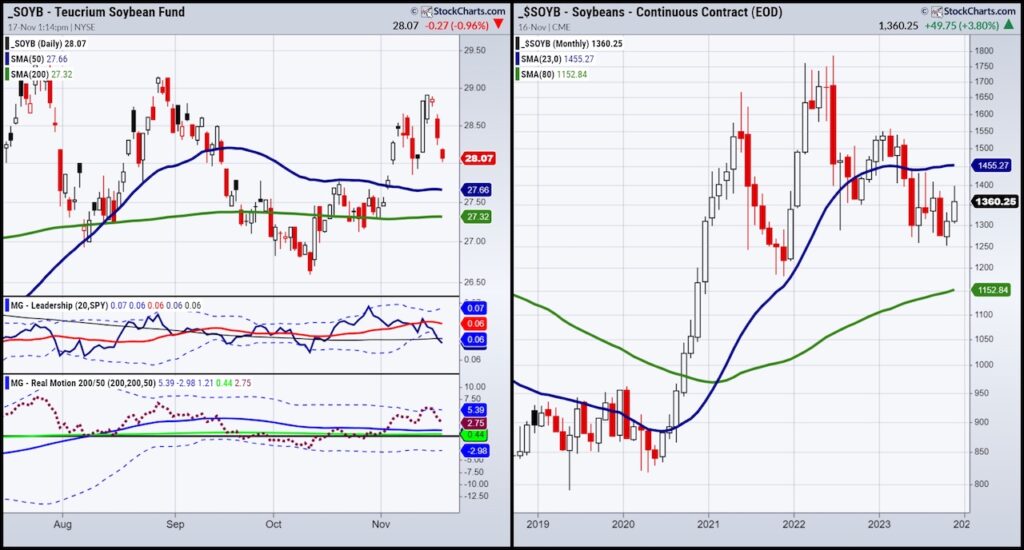
“Meanwhile, the Teucrium Soybean Fund SOYB saw a huge influx of investor money.
The monthly chart featured shows prices hovering around all-time highs.
In 2012 the high was 28.88. In July this year, SOYB made a new high at 29.43.
The sideways consolidation on this monthly chart suggests a move to 34-35 is possible.”
The daily chart is in a bullish phase-YES
The futures contract here, shown through the continuous contract and not the January 2024 contract, looks different.
The continuous contract is under the 23-month MA while the futures contract of the ETF sits above the 23-month.
Sideways consolidation-YES
Read to run? -NOT YET.
But watch for a move over 1400 in January 2024 contract as a good start provided this holds 1250.
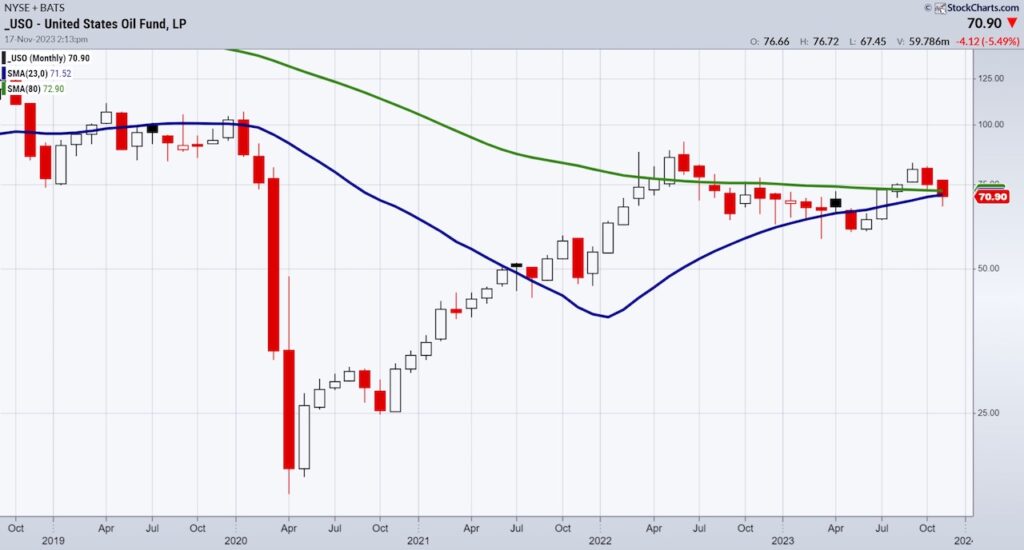
The next Daily this week was titled: Oil the New Gold-Buy When There’s Blood in the Street
The thesis was oil is a buy just as everyone got bearish. Just like gold, “you buy it when it looks awful, sell it when it looks strong.”
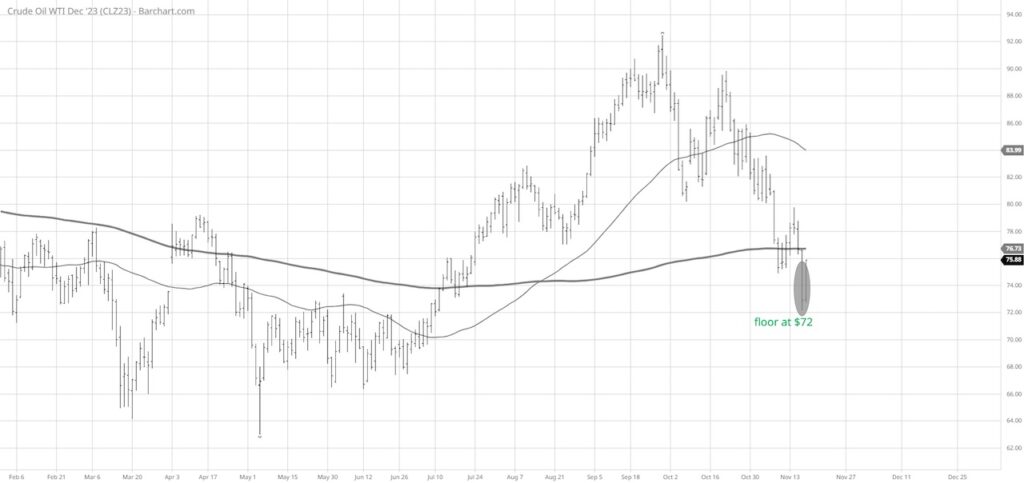
The futures contract (December) shows you that $72 held Friday with a move to nearly $76.
Was it a buy with blood in the streets? YES
Do we have a support level now?- YES
If you have a listen of my 2 latest videos in the media section below, you will hear that I boldly called a bottom and describe what levels must clear from here.
This coming week, watch for oil to get over $76 to continue the rally.
Twitter: @marketminute
The author may have a position in mentioned securities at the time of publication. Any opinions expressed herein are solely those of the author and do not represent the views or opinions of any other person or entity.


