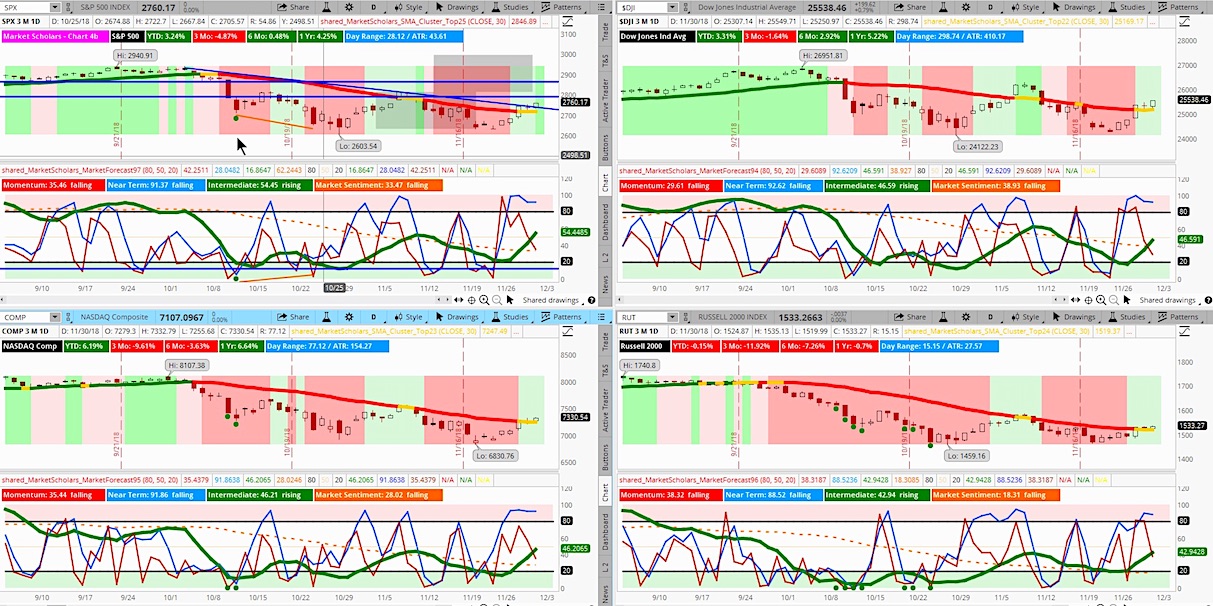
The intermediate line (green) on the Market Forecast for the S&P 500 (NYSEARCA: SPY) has moved above 50. This signifies the beginning of a new bullish intermediate run that can last 1-3 months. (see video and/or chart below)
This is bolstered by the S&P 500 getting above its 6-week moving average and that average slowing starting to turn higher.
The position of the long-term Market Sentiment line (orange) suggests this may be the first of multiple intermediate rallies similar to what we got this year between early May and early October (2 different runs separated by the intermediate pullback in late June).
The S&P 500 not only closed above its 200-day MA but also its 50-day MA. This is another bullish sign for stocks to close immediately back above the 200-day MA after such a sharp drop below it last week. Keep in mind, last week’s drop occurred on a 3.5 day trading week.
S&P shows 3 green arrows again on its 6-week moving average, MACD and Stochastic indicators.
Bullish divergences playing out on MACD and Stochastic indicators
Subscribe to the Market Outlook daily email list to get the daily and weekly overbought and oversold Market Forecast clusters watchlists for the S&P 500.
Weekend Market Outlook Video – Week of December 2:
Below are additional bullet points of market items discussed in this weekend’s video:
- S&P 500 closed above 4-week midpoint, this week’s Heikin Ashi open, the 200-day MA and last week’s high. And, its easily trading in the upper half of the 4-week change. Very positive turnaround from last week
- Volume and trading ranges are moving lower despite volatility holding up with this weekend’s potential trade news staying on traders’ minds over the next couple of days.
- Employment and manufacturing data will be next week’s key economic event. Plus, markets will be closed Wednesday for a National Day of Mourning for former President George H.W. Bush.
- International stocks pulled back today but had a good week – especially the Emerging Market space. This area is expected to lead on any U.S. dollar weakness going forward.
- Safe haven sectors continued to show strength but Healthcare had the best care with beaten up Biotech showing signs of life.
- Rate hike odds rose but still remain just below the 50% mark for March. The jobs and wage data will be key this week to see if that number jumps above 60%
- Bullish trade idea in Healthcare sector that shows similar reversal pattern and beginnings of new trend development to many areas in the broad market.
Twitter: @davidsettle42 and @Market_Scholars
Any opinions expressed herein are solely those of the author, and do not in any way represent the views or opinions of any other person or entity.


