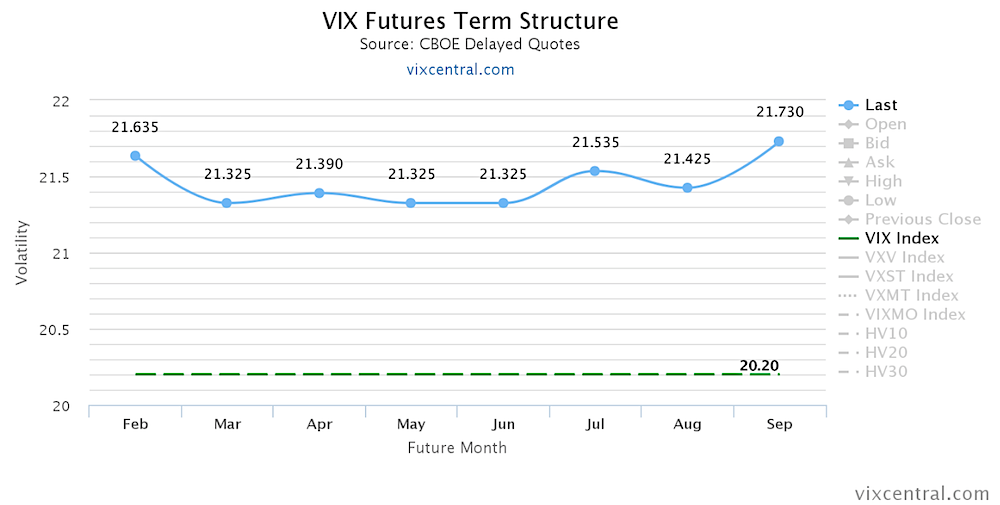
The term structure of VIX futures has also flattened out and is trading above spot VIX. The curve isn’t quite back to healthy contango, but it’s trying.
Market Stats:
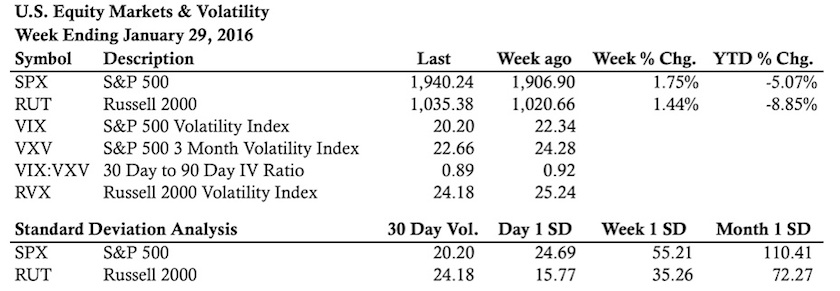
Stock Market Price Levels of Interest:
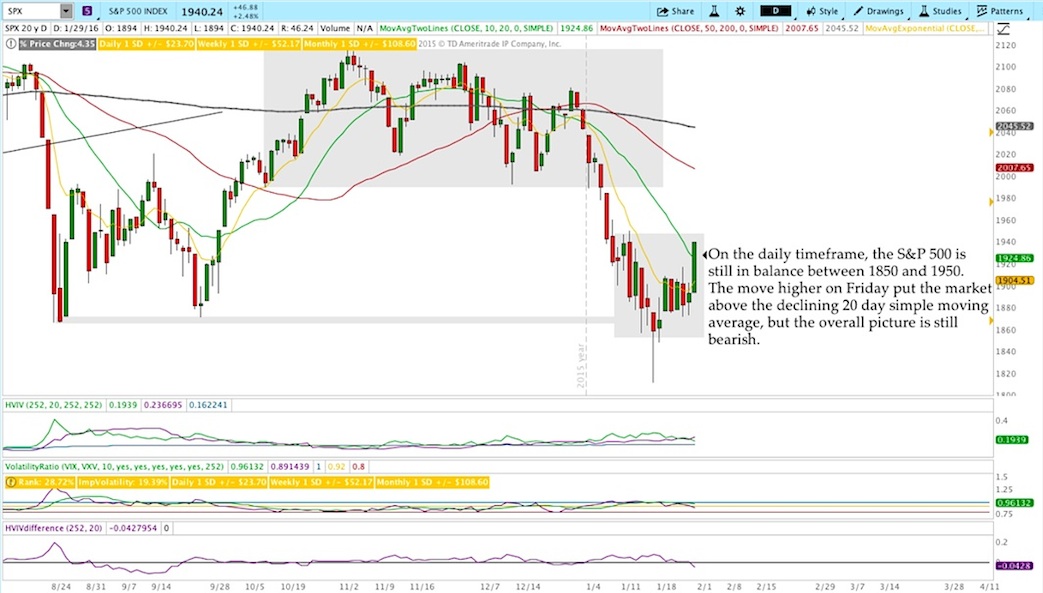
In the levels of interest section, we’ll drill down to the daily timeframe to see what’s happening in the markets. We’ll look at the S&P 500 Index (SPX) and the Russell 2000 ($RUT).
S&P 500 Index – $SPX Daily Chart
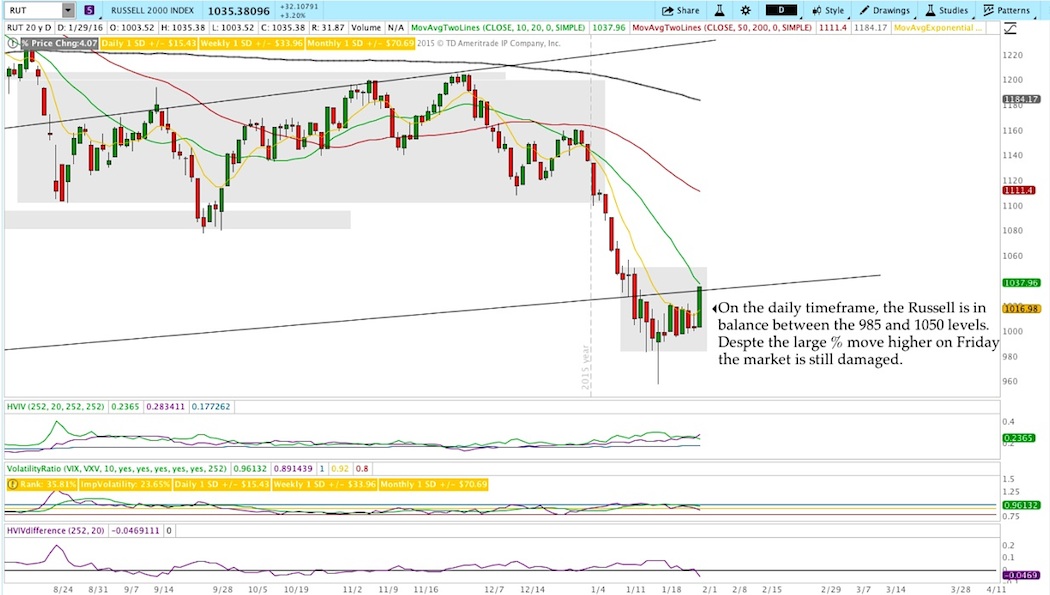
Russell 2000 Index – $RUT Daily Chart
Thanks for reading.
Twitter: @ThetaTrend
Author holds positions in S&P 500 and Russell 2000 related securities at the time of publication. Any opinions expressed herein are solely those of the author, and do not in any way represent the views or opinions of any other person or entity.


