 By Andrew Nyquist
I’m bored. Yep, that pretty much sums up the market action over the past few weeks. Little pockets of volatility and beta, but really no macro edge. As well trading setups have been slow to develop. So in short, I’ve been sitting on the sidelines making some quick trades but trying not to force too much action. I’m 40% invested here but okay with this as the market has some clearly defined levels for risk on and risk off.
Another reason for my continued fickle approach has to do with the weekly sell setups that came into play on the S&P 500 and Nasdaq 100 a few weeks ago following the overbought ramp on Mario Draghi’s promise to “do whatever it takes.” But time has passed and the market has turned sideways, offering up some backing and filling. Although this narrow sideways action could continue a bit longer, my antennae tell me that the market is gearing up for some range and volume expansion… as well, the Labor Day weekend will soon be behind us, ushering in the start of September trading. On Tuesday, many big players will be back in the saddle, ready to get after it.
Heading into September, the S&P 500 is up over 11 percent and the Nasdaq Composite up over 17 percent. It’s really been quite a good year thus far. And the best way to ensure our continued success as investors/traders is by understanding the technical support and resistance setup levels that assist in signaling risk on and risk off. Remember, it is also our job to protect paper gains and put profits in the bank.
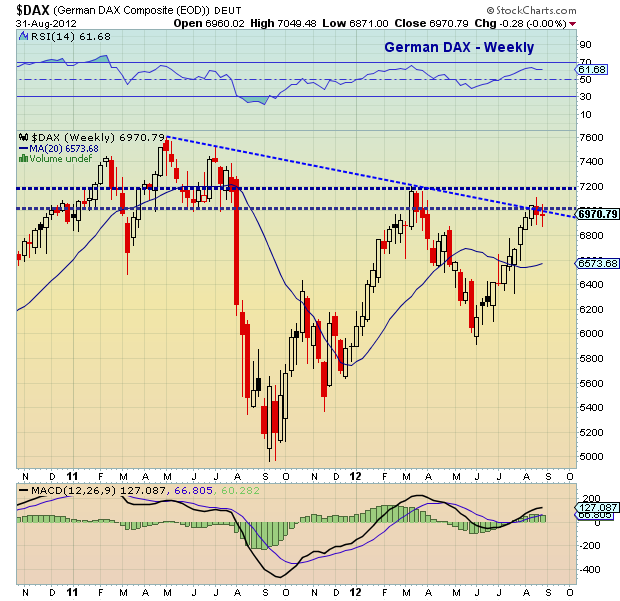
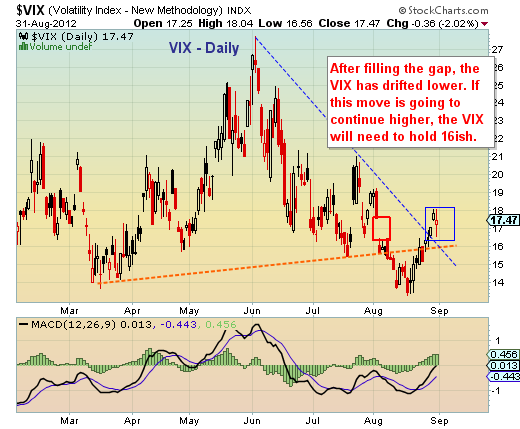
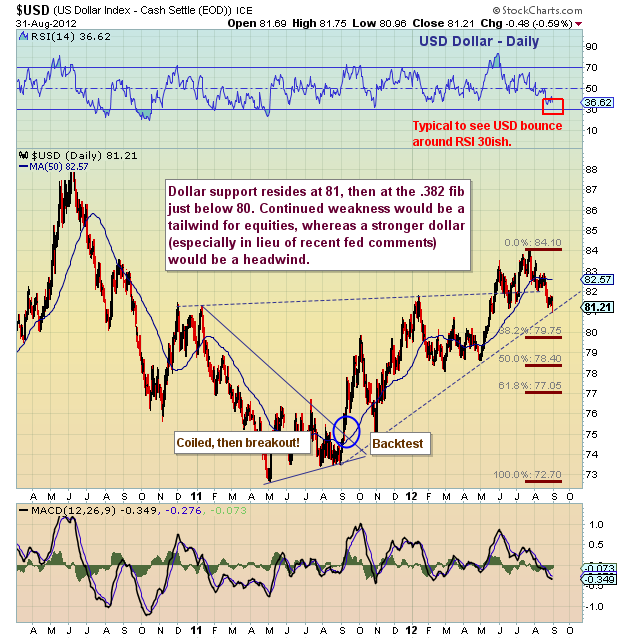
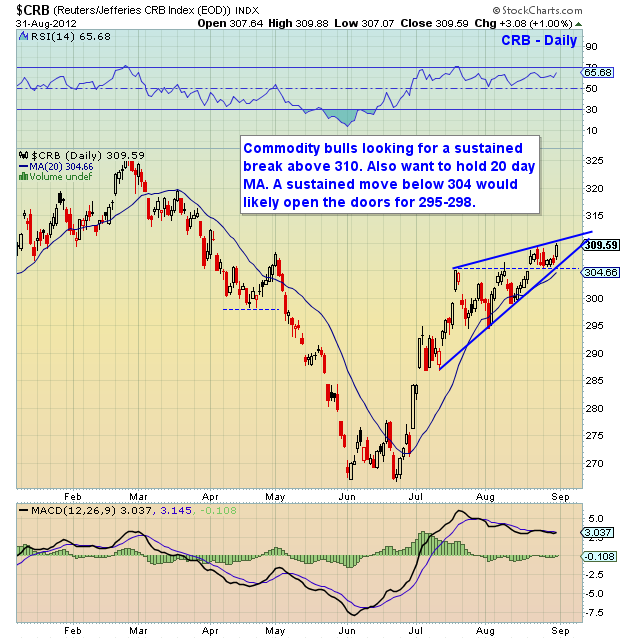
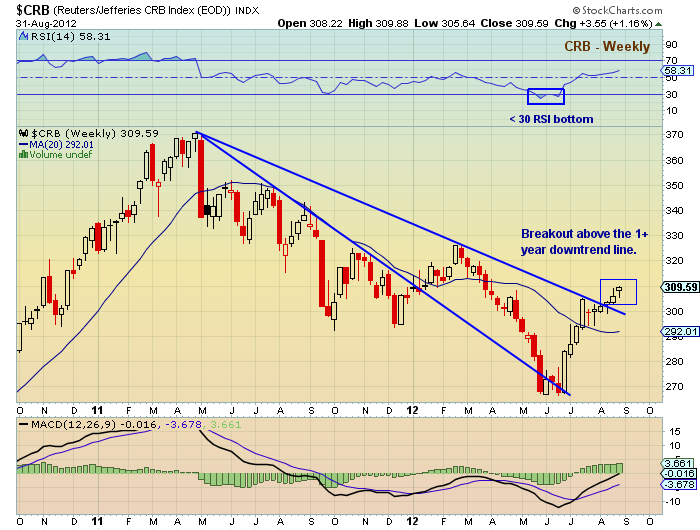
This week I will run through the usual suspects: the S&P 500, Nasdaq 100, US Dollar Index, and Volatility Index (VIX). In addition, I will include snap shots of the German DAX and Commodity Index (CRB), as both will provide insight and indication as to the level of QE and easing expectation at home and abroad: Bernanke-fest is still being combed over for QE3 (or 4? Or 5?) vibes and Mario Draghi and the European Central Bank (ECB) are on tap Sept 6th and Sept 12th likely offering more detail on bond buying plans. As well, both Silver (SLV) and Gold (GLD) broke out last Friday and will look for through this week to confirm the breakouts (see charts here).
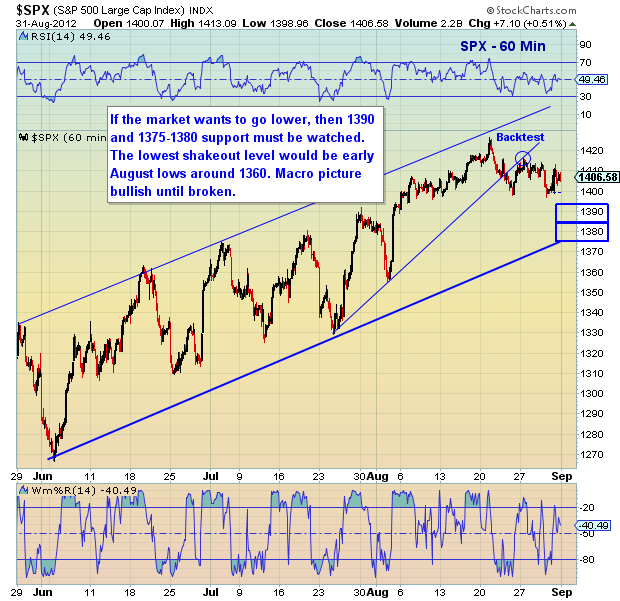
S&P 500 Hourly Bar Channel Chart:
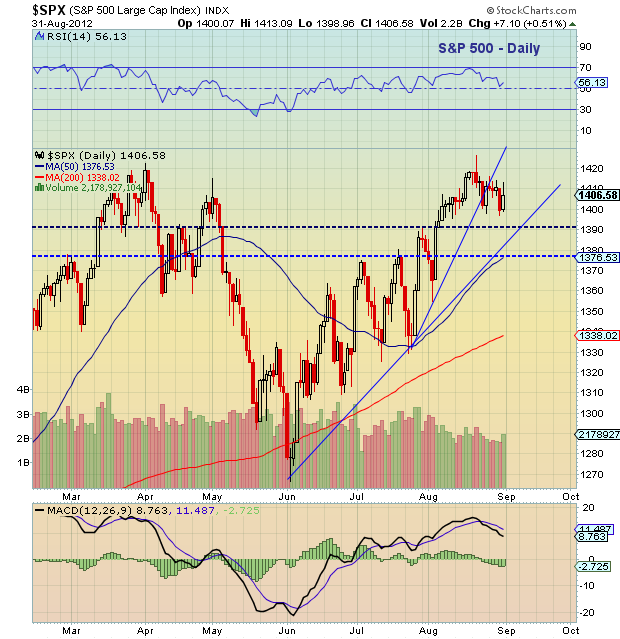
S&P 500 Daily Bar Chart:
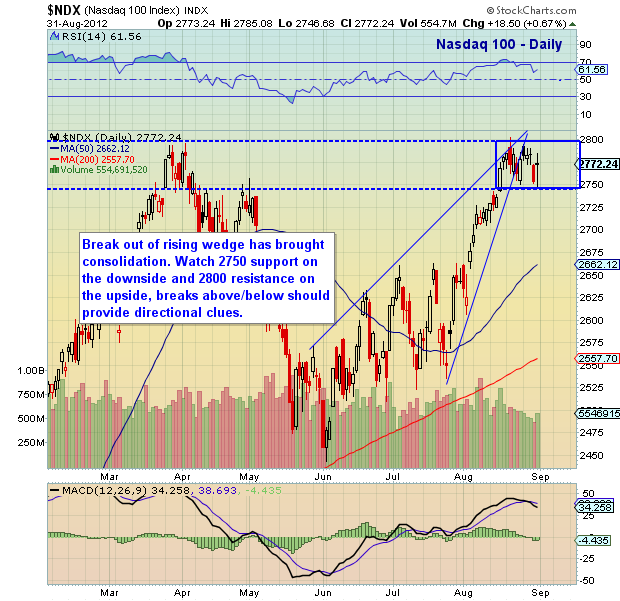
Nasdaq 100 Daily Chart:
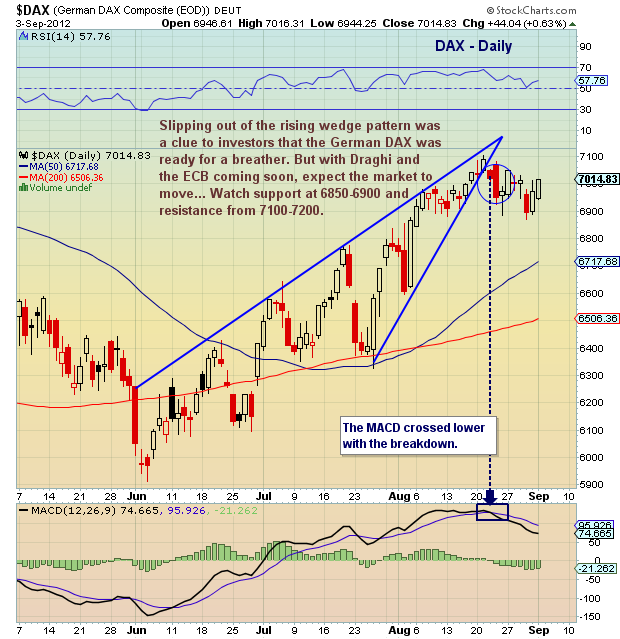
German DAX Daily & Weekly Charts:
Volatility Index Chart:
US Dollar Chart:
CRB Commodity Index Daily & Weekly Charts:
Have a great week ahead. Trade safe, trade disciplined.
———————————————————
Twitter: @andrewnyquist and @seeitmarket Facebook: See It Market
No position in any of the securities mentioned at the time of publication.
Any opinions expressed herein are solely those of the author, and do not in any way represent the views or opinions of his employer or any other person or entity.

