Market bears finally showed up late in the week and brought some selling. But not before the S&P 500 and Nasdaq closed the week higher.
In this week’s “Weekend Market Outlook” we will discuss several topics, including the potential for weakness into mid-September. Below is a summary of what’s in the video below. Please feel free to comment or hit us up with any questions.
Market Outlook & Video (September 1):
– Another aborted near-term run (less than 7-12 days) suggests we’re nearing the end of the current intermediate rally.
– S&P 500’s weekly chart shows another longer upper shadow on its candle. The weekly market forecast suggests there could be a week or two of weakness ahead. But, despite, that the monthly chart aligns with expectations that stocks could be higher into the end of the year and into Q1.
– High position above the 50-day MA and 200-day MA also suggest that – at best – we’ll start grinding higher a lot more slowly than we did even this week.
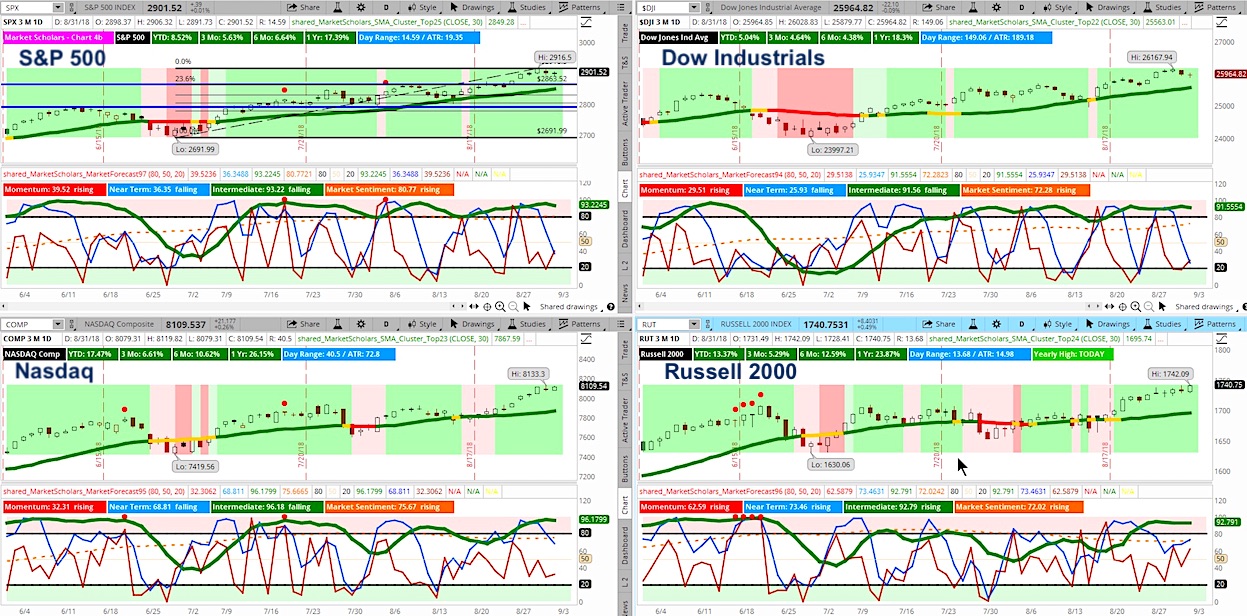
– High MACD and Stochastic %d positioning also suggest next week may only see slightly higher highs.
– Still have strong bullish positioning on intraday chart, with trading ranges and volatility.
– Weakening economic indicators puts pressure on yields.
– Avoiding a second consecutive day of EM weakness helps from contagion spreading with today’s weakness in Europe instead.
Twitter: @davidsettle42 and @Market_Scholars
Any opinions expressed herein are solely those of the author, and do not in any way represent the views or opinions of any other person or entity.


