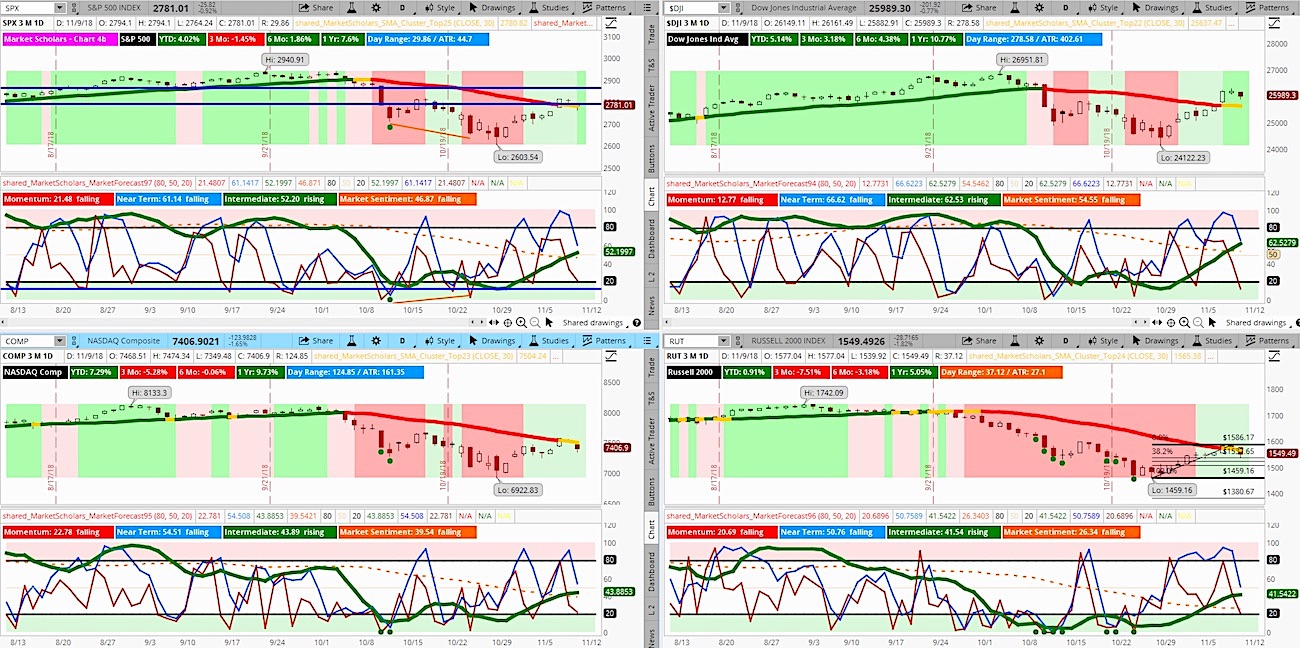
The S&P 500 (SPY) finished lower for the second day in a row starting a near-term (blue line) pullback as the intermediate line (green line) is crossing above the chart’s midpoint.
This sets up the possibility for a 1-3 month run that matches the seasonal trend into the end of the year before weakness hits in January.
We are looking for a move into the 2750 area on the S&P 500. The NASDAQ (QQQ) and Russell 2000 (IWM) relative weakness suggest there is more downside to occur in the short term.
The S&P 500 is looking at a move similar to late February-early March where bullish intermediate run off extreme lows did not reach new highs.
The S&P 500 finished above the 200-day MA two weeks after closing sharply below it. As well, the S&P closed above the highs of the past two weeks.
The Dow Industrials finished back above its 50-day MA. And the close on the Russell 2000 is forming a death cross, which has actually been bullish for the small-cap index in the past.
Weekend Market Outlook Video – November 10:
Below are additional bullet points of market items discussed in this weekend’s video. Learn more about our service over at Market Scholars.
- Sharp convergences to zero on the MACD usually don’t follow with upward divergence to extreme highs. Look for a pullback first to a smaller low below the chart’s midpoint.
- The S&P 500 down from a new 4-week high from yesterday – less than 2 weeks after forming an extreme 4-week low. S&P closed above last week’s high, this week’s Heikin Ashi open and the four-week midpoint.
- Volatility is trending lower but still not at moderating levels yet. This keeps the door open for bigger pullbacks in short term
- Safe haven moves today but not extremes with strong performance in long-term bonds. In fact, biggest losers today were the biggest winners since the rally began
- Weakness in crude oil can be attributed to strength in dollar since April that was never felt in the commodity price until the past two months.
- During the run in the greenback, Energy, Industrials and Materials lagged. They have been bouncing strongly the past two weeks but have given up some of their gains today.
Twitter: @davidsettle42 and @Market_Scholars
Any opinions expressed herein are solely those of the author, and do not in any way represent the views or opinions of any other person or entity.


: Creating Bullish Divergence?")


