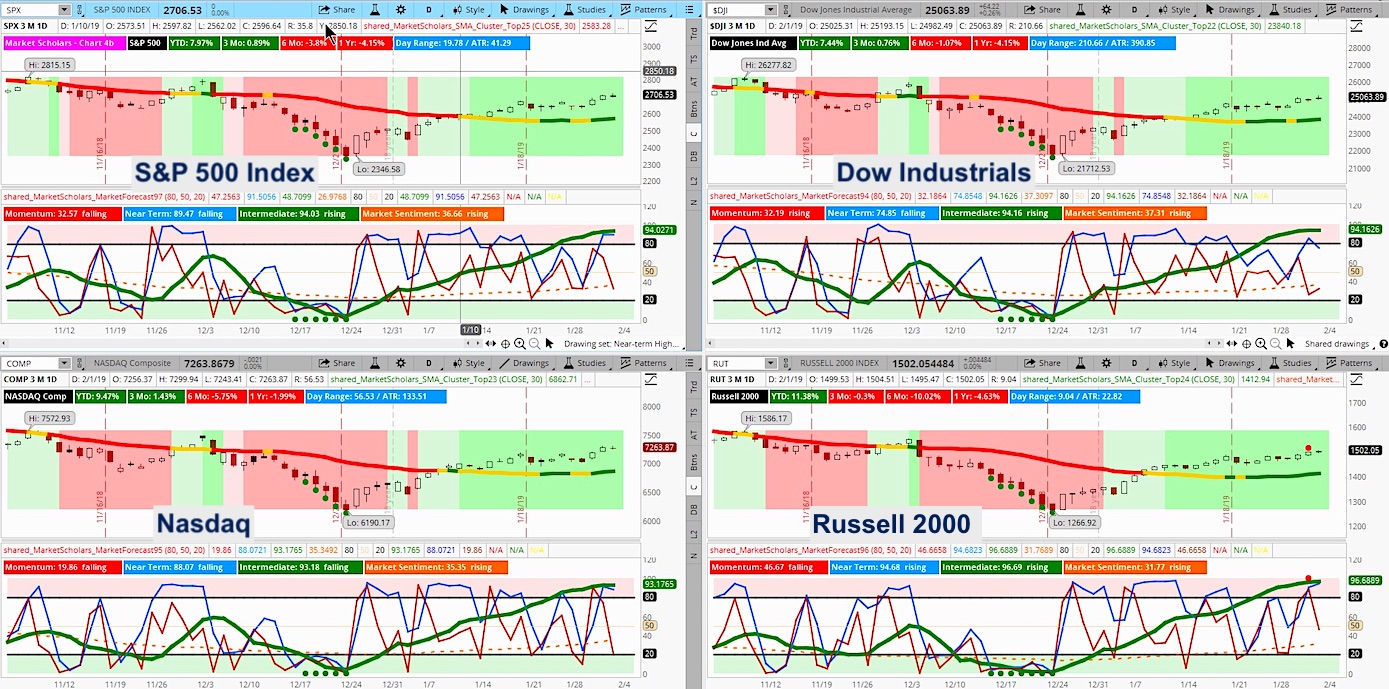
The S&P 500 continues to push beyond near-term expectations into new levels of resistance without producing a healthy pullback (since bottoming on Christmas Eve).
Short-term momentum is strong and can continue through multiple layers of resistance at current levels toward 2,800.
Of course, the longer stocks rally without a re-test of their December lows, the more likely we get another sharp pullback similar to last February.
Cycle and Fibonacci analysis suggest we may get a 5% pullback to Fibonacci support levels some time after February expiration. Again, last year it took a nearly two months to consolidate a solid base to build a sustained bullish trend, one that lasted to early October.
So far, YTD returns are strongly above seasonality expectations. Of course, this is another reason to expect stocks to hit their head against proximal resistance areas.
The S&P 500 has reached its falling, one-year Linear Regression Trend Line – just weeks after closing multiple standard deviations below it on Christmas Eve. It’s also testing its 200-day moving average. Possible bearish divergences are setting up on its Full Stochastic (14,5,5) indicator with MACD (8,17,9) hitting extreme levels that it hasn’t hit since last January
Subscribe to the Market Outlook daily email list to get the daily and weekly overbought and oversold Market Forecast clusters watchlists for the S&P 500.
Weekend Market Outlook Video – Week of February 4:
Below are additional bullet points of market items discussed in this weekend’s video:
- Weekly Heikin Ashi candles have been bullish the past few weeks after only one transition period after its bearish run. This is atypical and this week may be the first transition week that starts a Fibonacci retracement down from resistance with key levels to watch within its four-week range highlighted in the Market Outlook video.
- Trading ranges, volume and volatility are falling but still not to levels that suggest a persistent bullish trend has begun. There is still room for more volatility.
- Strong volume supply is sitting both around 270 and 20 on SPY that can act as resistance levels.
- Strong jobs report impacted risk appetite early but the predominant trade right now is a weakening dollar and falling interest rates.
- Gold and commodities, particularly crude oil, benefit in this environment – along with Emerging Markets.
- Real Estate and Utilities are interest-rate sensitive sectors that also outperform in falling rate environments. This week’s sector rotation was led by safe haven areas and specific earnings releases.
- Bearish trade example in Consumer Discretionary sector. Stock is showing emerging bearish trend signals after its earnings release that suggest there may be some short-term weakness that traders can take advantage of.
Twitter: @davidsettle42 and @Market_Scholars
Any opinions expressed herein are solely those of the author, and do not in any way represent the views or opinions of any other person or entity.

: Showing Some Signs of Emerging Strength")
