There were several market messages in today’s price action.
Starting from the top…
The S&P 500 (SPY) finally closed at an all-time high… and after what seems like weeks of anticipating this moment.
The S&P 500 closed over the price level by fractions of a percent, while recording a doji pattern. This follows a doji pattern yesterday. My emphasis on the doji is because a doji pattern is defined by candlestick charts as meaning “indecision”.
Two days of indecision at all time highs often leads to expansion.
I’m not suggesting this is a top, especially with the strength of large cap tech stocks and the Nasdaq 100 (QQQ). But if the S&P 500 trades below today’s low tomorrow, remember these double dojis. Bulls should do the same if the S&P 500 breaks higher.
The second market message was in retail.
Walmart (WMT), Home Depot (HD), and Kohls (KSS) all reported better than expected earnings and then all sold off.
“Good news bad action” is a bad omen for stocks at highs. As a result, we should watch WMT and HD closely if they begin to correct. KSS on the otherhand is stuck in a base so its selloff is less telling if it declines, and more encouraging if it reverses higher in the coming days.
But that only half the reatail story.
The more interesting (and the trading opportunity half) is that while WMT’s blowout performance didn’t boost its stock today, it caused another retail stock to breakout to the upside!
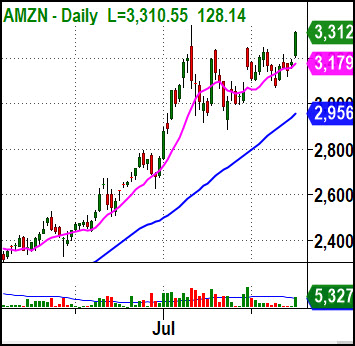
If you took note of today’s image then you know I’m referring to Amazon (AMZN), which exploded out of a month-long consolidation on big volume to an all-time closing high. It makes sense that if Walmart’s (WMT) online business is doing well, then AMZN’s is likely just as well if not better.
If you like to trade hot stocks that have big ranges. Amazon (AMZN) should now be on your watch list. Today it was just like Tesla (TSLA) from yesterday – the 5-min. OR breakout. Tomorrow look for a 30-min. OR reversal if it pulls back.
Finally, the Semiconductors Sector ETF (SMH) surprised me today.
I was so focused on TSLA, AMZN and and Bitcoin (a story for another day) to notice until the close that while the QQQ was advancing 1% out to new highs, sister Semi (SMH) was weak enough to close down and below its prior day low!
What’s going on? Are the Semi’s tired?
Nvidia (NVDA) reports earnings tomorrow so that could change the SMH chart substantially.
If history is any guide, the NVDA news will probably be bullish in the headlines, but you know from today’s retail message that there’s more to look out for.
I’ll be looking for good news and good action.
Bad news would likely be very uncomfortable for the market.
Good news and bad action would be better, but not good.
While that may sound like a bearish conclusion, I’m not bearish. I’m just just not as complacent as the Volatility Index.
S&P 500 (SPY) New all-time closing high (with a doji). Watch 330 as important support
Russell 2000 (IWM) Weak all day. Key level to break above is 158, then 160 is resistance area. Today’s low sits right below the 10 DMA and then 153 is key support.
Dow (DIA) Weak day, found support at 10 DMA. 276.50 is pivotal support
Nasdaq (QQQ) Strong move out of 7-day range. 260 is key support level and a trendline.
TLT (iShares 20+ Year Treasuries) Closed over prior day high. Resistance area is at 166. 162 next big support.
Twitter: @marketminute
The author may have a position in the mentioned securities at the time of publication. Any opinions expressed herein are solely those of the author, and do not in any way represent the views or opinions of any other person or entity.


 – Warren Buffett’s Biggest Holding!")
 May Tip Stock Market’s Next Move")


