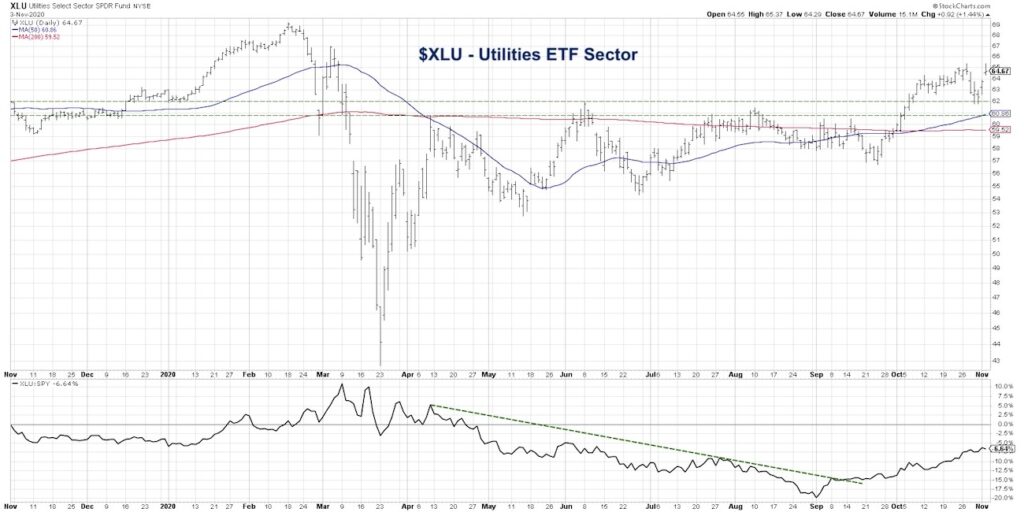
While reviewing the 11 S&P 500 sectors and identifying stronger charts in the pile, it’s hard to find a better setup than the Utilities Sector (XLU).
The XLU chart also provides a textbook example of big base breaking on improving relative strength.
To summarize, it’s a solid chart with a solid setup.
When you look at the last year for the Utilities sector, it looks fairly similar to the chart of the S&P 500. A consistent rally into the February high was followed by a rapid selloff into the late March low. From there, you had an initial upswing and pullback in April before a run up to a new swing high in June. But the relative strength, however, had already started to deteriorate.
Through the summer months the XLU continued to find resistance in the 61-62 range. This happened as many stocks, as well as the S&P 500, were making new highs into September. This resistance range persisted through August and September as the relative performance suffered.
That all changed in September.
As the broad market topped out in early September and started to pull back, the Utilities sector began to rally as the relative strength picture improved. Then in early October you had a new price high as the relative outperformance continued.
Now we see the price has pulled back to that same congestion range of $61-62, showing that resistance levels often become support after a breakout occurs. The XLU is once again testing new price and relative highs.
If we’re saying that the upside potential for a defensive sector like Utilities is real, and that outperformance is probable going forward, does that imply a bearish perspective on the overall markets?
Not necessarily.
If you look back to 2014, equities were in a cyclical bull market within a secular bull market. Stocks had rallied nicely off the 2009 market low, and in 2013 the S&P 500 had finally eclipsed the 2007 highs.
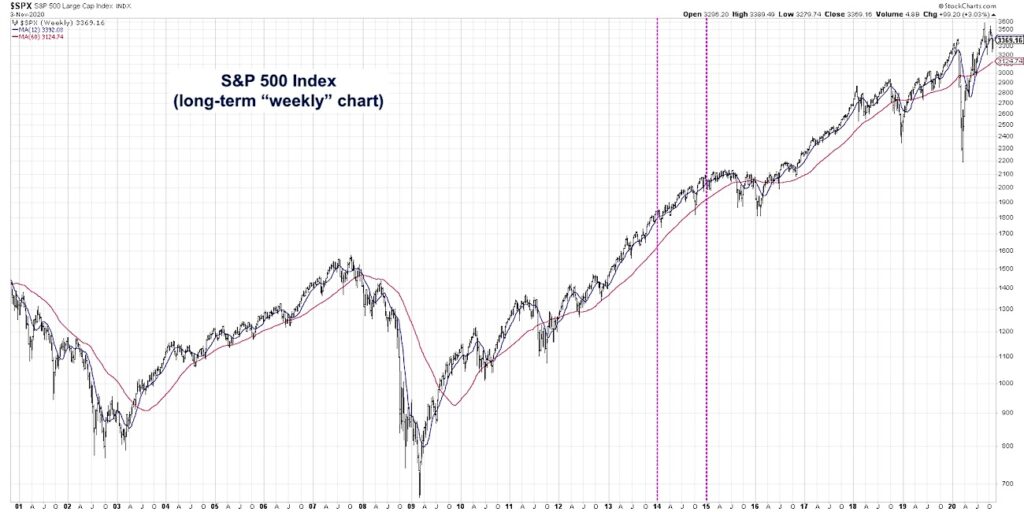
So what sector was the top performer of the 11 S&P sectors in 2014?
No, not Technology… or Consumer Discretionary… or Health Care… or Industrials… or Materials…
It was Utilities.
So even if you had perfect foresight and knew the market was going to go higher, you most likely would not have selected Utilities as a key overweight. You would probably have gone with the traditional offense like I listed above.
The lesson here is to focus less on what should work and focus on what is working. Based on the charts, Utilities are working now.
To see this article in video format, check out my YouTube channel!
Twitter: @DKellerCMT
The author may have a position in mentioned securities at the time of publication. Any opinions expressed herein are solely those of the author, and do not in any way represent the views or opinions of any other person or entity.
")


")
