The Utilities Sector (XLU) doesn’t get a lot of headlines. In fact, many investors don’t even pay attention to it.
But for that reason, it’s smart to pay attention. Because you know something is off when a slow and steady sector veers off course.
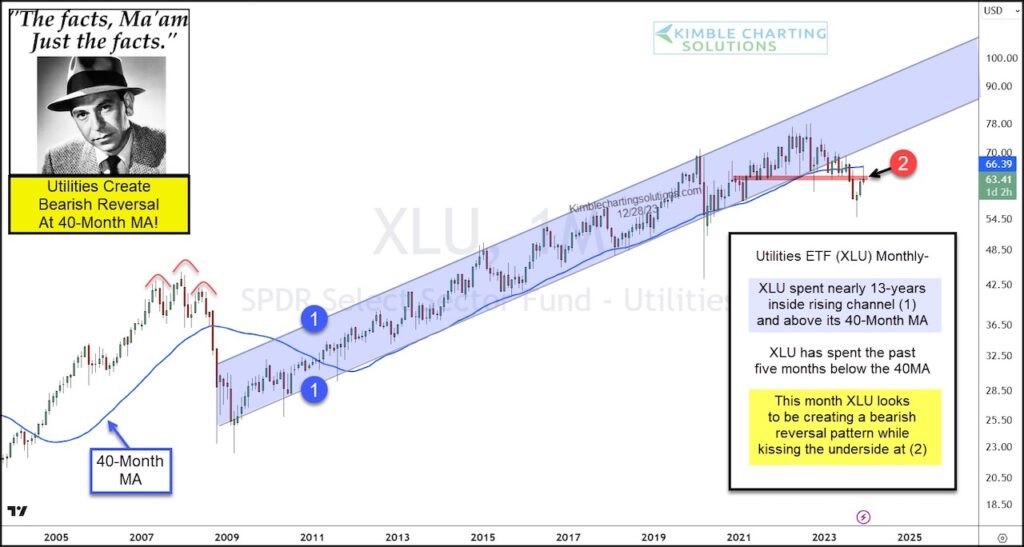
“The facts, Ma’am. Just the facts.” – Joe Friday
Below is a “monthly” chart of the Utilities Sector ETF (XLU). As you can see, XLU broke down and out of its 13-year rising channel a year ago. It also created a large bearish reversal just under its 40-month MA and resistance at (2).
XLU is attempting to recover. And stock bulls want/need to see XLU breakout at (2)… not top! Stay tuned!!
$XLU Utilities Sector ETF “monthly” Chart
Note that KimbleCharting is offering a 2 week Free trial to See It Market readers. Just send me an email to services@kimblechartingsolutions.com for details to get set up.
Twitter: @KimbleCharting
Any opinions expressed herein are solely those of the author, and do not in any way represent the views or opinions of any other person or entity.


