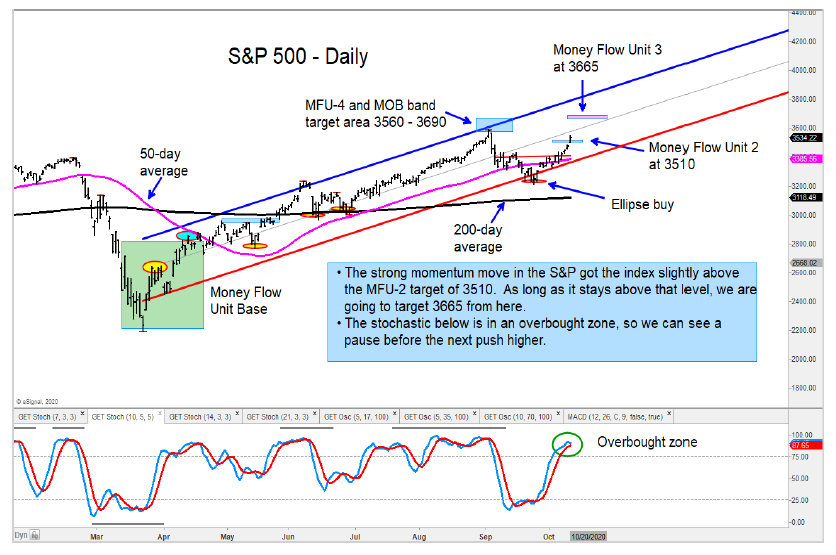
The S&P 500 Index, Nasdaq Composite, Mid-Caps, Dow Transports, and Dow Utilities are moving into price target zones where investors should expect a pause or pullback to begin.
The strong momentum of the last five days has these price targets getting hit quicker than expected.
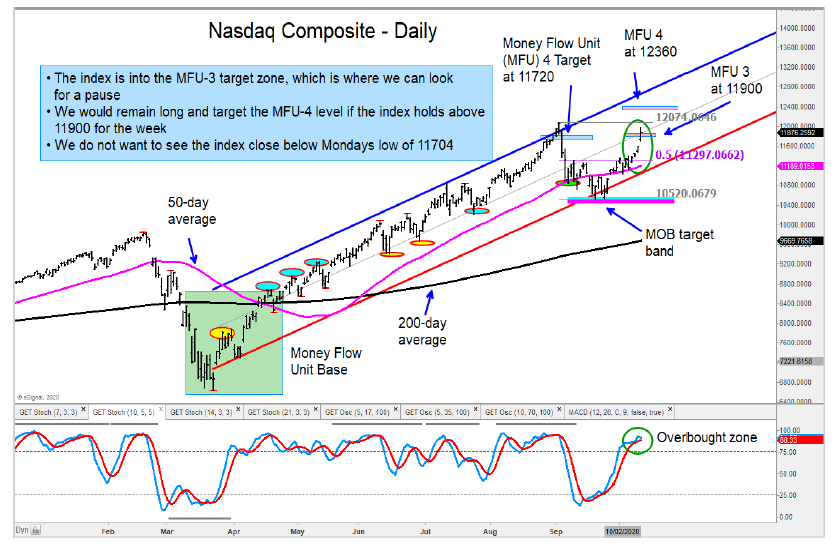
Here’s the Nasdaq Composite chart with targets and analysis:
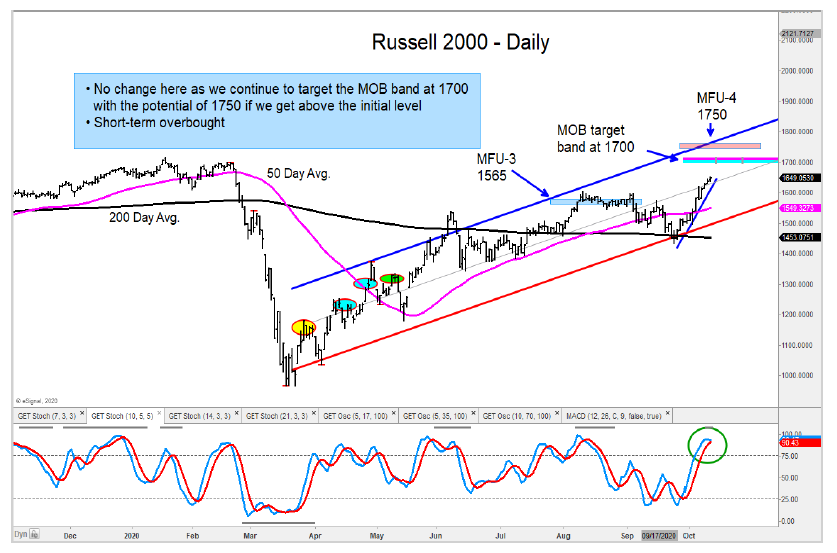
The Russell 2000 appears to have more room to run before it comes into identifiable target areas.
The Long-Term Treasury Bonds ETF (TLT) has started to turn up from the MOB target and its rising 200-day average. We are expecting a short-term rally from here.
My health care equally weighted index continues to charge higher and is about halfway to its target zone.
The Technology Sector (XLK) came into its target zone on Monday, and we are expecting a pause/pullback from here. We suggest trimming extended names.
The author has a position in the mentioned securities at the time of publication. Any opinions expressed herein are solely those of the author, and do not in any way represent the views or opinions of any other person or entity.


