U.S. equities markets continue to show strength as we head into the end of July.
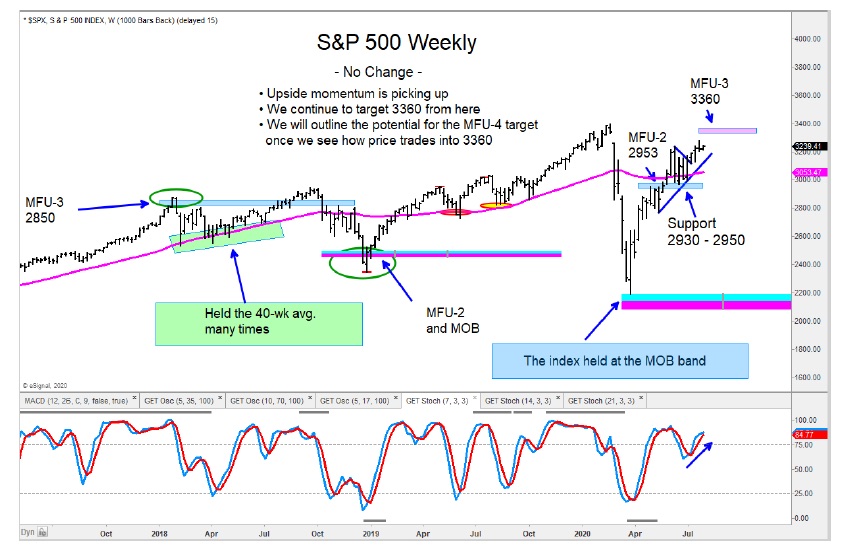
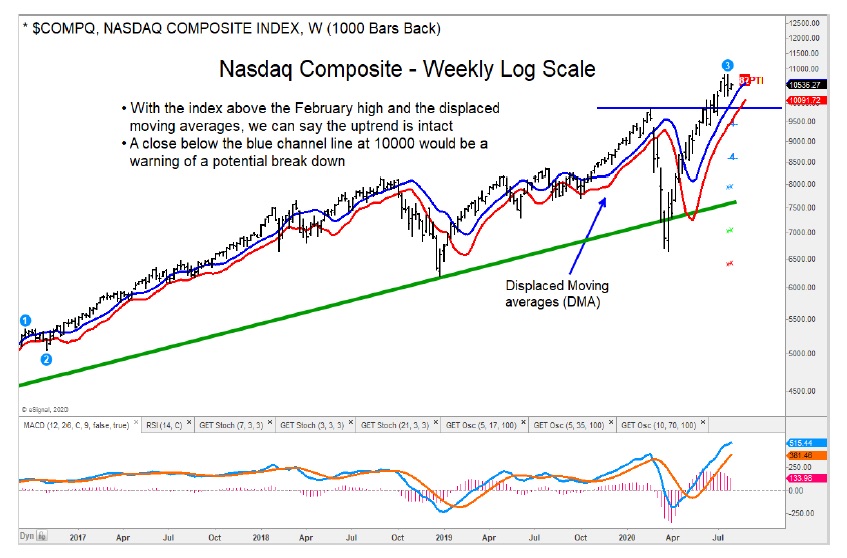
Trends for the S&P 500 and Nasdaq Composite remain favorable for investors.
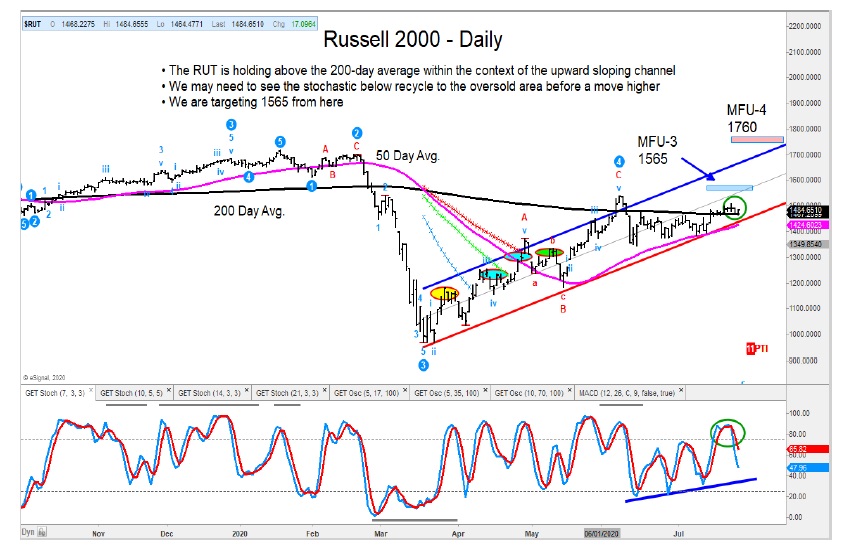
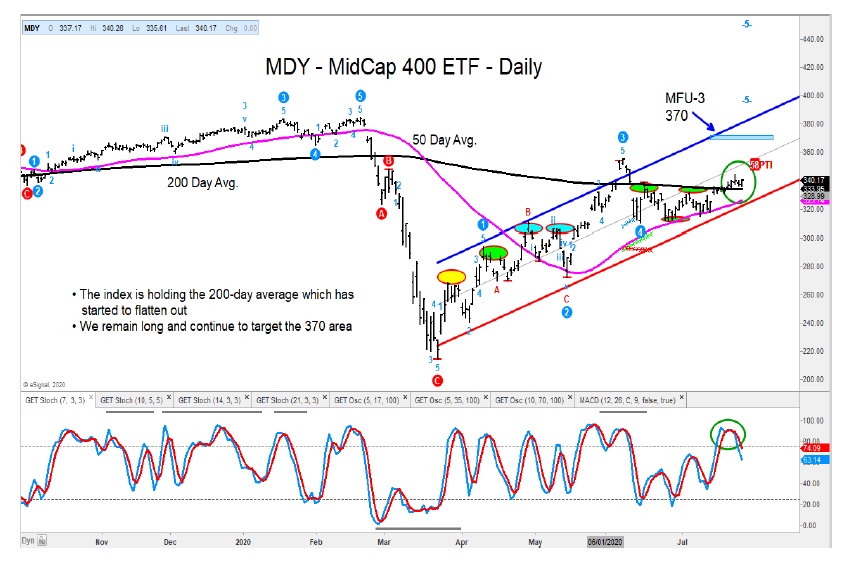
As well, I continue to see improvement in the Russell 2000 and Mid-Cap (MDY).
Both the S&P 500 and Nasdaq Composite remain well contained in their upward sloping regression trend channels off the March low, and those trends remain intact.
The Russell 2000 and Mid-Cap MDY have held their respective 200-day averages and continue to show improvement.
The Utilities Sector (XLU) continues to struggle as it remains in a weak trend. I would continue to avoid this sector.
S&P 500 “weekly” Chart
Nasdaq “weekly” Chart
Russell 2000 “daily” Chart
Mid-Cap “daily” Chart
The author may have a position in mentioned securities at the time of publication. Any opinions expressed herein are solely those of the author, and do not in any way represent the views or opinions of any other person or entity.


