The equity markets showed little progress last week but closed out the first two months of the year with the strongest gains in more than a decade.
For the month of February, the S&P 500 and Nasdaq Composite logged gains of 3 percent.
The most recent economic data showed that gross domestic product expanded at a 2.6% annual rate in October through December of 2018. That followed a 3.4% growth rate in the third quarter and a 4.2% growth rate in the second quarter – and it beat economist expectations for a 2.2% rate.
In June the expansion will become the longest on record – 120 months. The numbers have been good but there will most likely be a slowdown since the effects of the fiscal stimulus are beginning to wear off. January of this year gave us a friendly Federal Reserve when they announced they would halt interest rate increases.
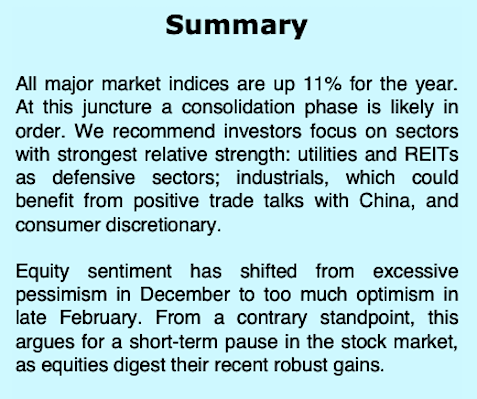
January also gave us a rebound from a huge sell-off in December, making stock valuations attractive. Additionally, earnings growth continued to be stable. All the major indices are up 11% for the year. At this juncture a consolidation is likely in order.
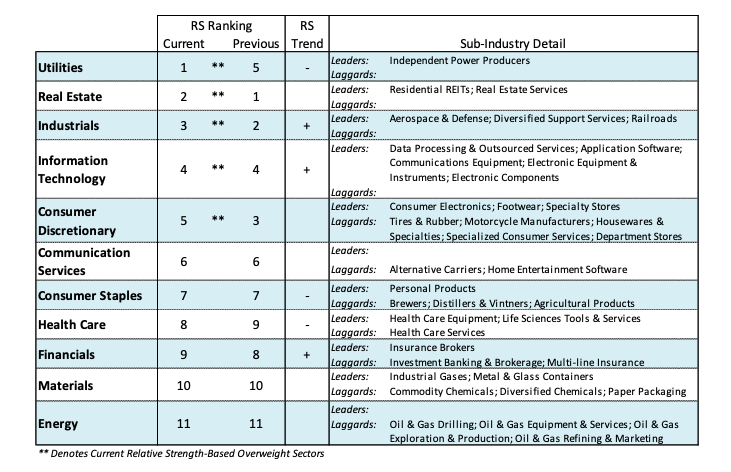
We recommend investors focus on sectors with the strongest relative strength – utilities and REITS as defensive sectors; industrials which may benefit from positive trade discussions with China, and consumer discretionary.
The short-term technical picture also speaks to a cautious approach near term. The most recent data shows stocks overbought with nearly 92% of S&P 500 issues trading above their 50-day moving average versus just 5% (oversold) in early January.
Measures of investor sentiment show psychology has moved nearly 180 degrees. The excessive pessimism witnessed in December has evaporated with optimism rising in late February to levels last seen at the September highs. The Ned Davis Sentiment Poll, which showed excessive pessimism two months ago has moved into the excessive optimism zone. Additionally, the latest survey from the American Association of Individual Investors (AAII) shows the fewest bears since January 2018.
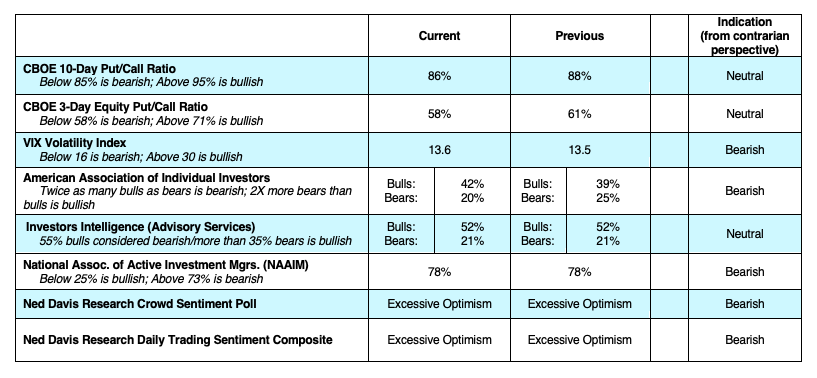
The most recent data from the Chicago Board of Options Exchange (CBOE) indicates that the demand for puts has dropped to the lowest level since the peak in the popular averages in September. The CBOE Volatility Index (VIX) echoes a similar story falling from 36, which indicated a high level of investor fear, plunging to 13 last week an indication that complacency has entered the building.
CHARTS
Twitter: @WillieDelwiche
Any opinions expressed herein are solely those of the author, and do not in any way represent the views or opinions of any other person or entity.


")

