Saturday marks the one year anniversary of the all-time high for the S&P 500 – and yet since then the stock market has been just a few percentage points away for much of the time. How depressing is that? This range bound market has tested the patience and fortitude of many traders as they try to find an edge in a painfully boring tape.
While we’ve seen some swings in both directions, stocks have largely been unable to show any strength after the weight of the evidence back in July turned bearish for the stock market. Back in late-July, I wrote a post titled The Greatest Risk of A Market Peak Since 2007.
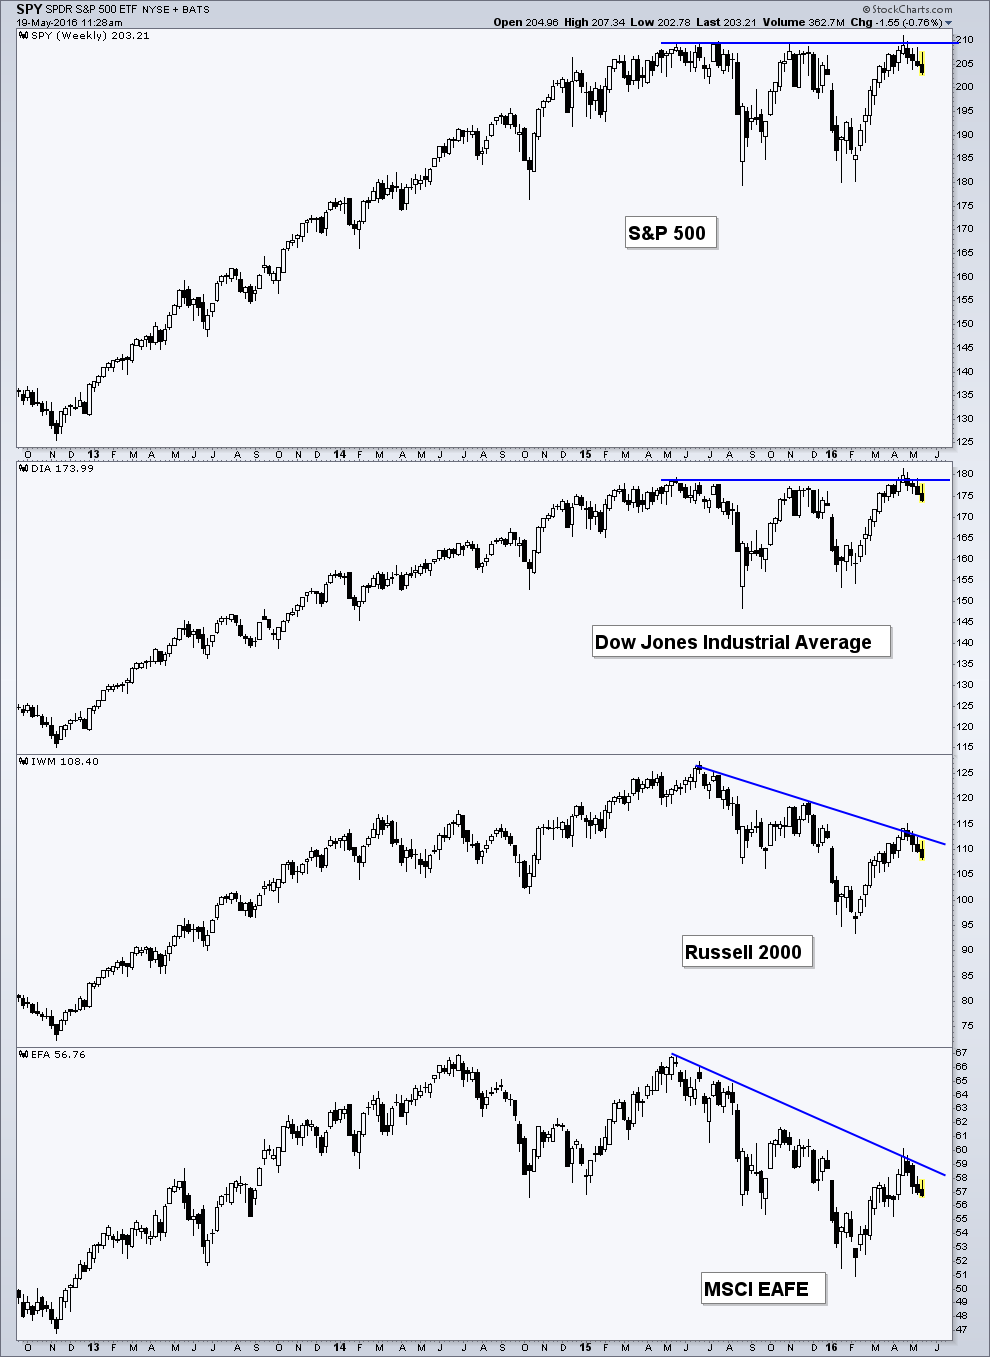
While there’s several pieces of data you could point to that show hints of brighter days ahead for equities, when you look at just a basic chart of the major stock market indices, it’s tough to get very excited. The S&P 500 has created a clear level of resistance at 2110. The Dow Jones Industrial Average has put in a false breakout from its prior high as price has come back into its year-long range. The Russell 2000 is in a down trend of lower highs and lower lows – as is the international index MSCI EAFE. This clearly looks like a range bound market with continuing bouts of volatility.
Eventually we’ll see a breakout. Stocks could be to the upside or to the down, but at this point the market looks more poised for the bears to retain control. However, as a price-focused trader I’m prepared for either conclusion. Patience has never been more of a virtue during the last twelve months in the equity markets as we all wait for the range bound market to resolve.
Thanks for reading.
Twitter: @AndrewThrasher
Read more from Andrew on his Blog.
Any opinions expressed herein are solely those of the author, and do not in any way represent the views or opinions of any other person or entity.

: Showing Some Signs of Emerging Strength")
